Showing posts with label DevSecOps. Show all posts

Monday, May 30, 2022

chaos engineering

  •  Chaos engineering techniques


One simple test, for instance, simply deletes half of the data packets coming through the internet connection. Another might gobble up almost all the free memory so the software is scrambling for places to store data.


The tests are often done at a higher level. DevSecOps teams may simply shut down some subset of the servers to see if the various software packages running in the constellation are resilient enough to withstand the failure. Others may simply add some latency to see if the delays trigger more delays that snowball and eventually bring the system to its knees


Almost any resource such as RAM, hard disk space, or database connections is fair game for experimentation. Some tests cut off the resource altogether and others just severely restrict the resource to see how the software behaves when squeezed


Buffer overflow problems, for instance, are relatively easy for chaos tools to expose by injecting too many bytes into a channel. 


Fuzzing is also adept at revealing flaws in parsing logic. Sometimes programmers neglect to anticipate all the different ways that the parameters can be configured, leaving a potential backdoor

Bombarding the software with random and semi-structured inputs can trigger these failure modes before attackers find them


Some researchers moved beyond strictly random injection and built sophisticated fuzzing tools that would use knowledge of the software to guide the process using what they often called “white box” analysis


One technique called grammatical fuzzing would begin with a definition of the expected data structure and then use this grammar to generate test data before subverting the definition in hope of identifying a parsing flaw.


Chaos engineering tools

The tools that began as side projects and skunkworks experimentation for engineers, and now growing into trusted parts of many CI/CD pipelines.  Many of the tools are staying open-source projects produced by other DevSecOps specialists and shared openly


https://www.csoonline.com/article/3646413/how-chaos-engineering-can-help-devsecops-teams-find-vulnerabilities.html


  • Chaos Engineering is the discipline of experimenting on a system in order to build confidence in the system’s capability to withstand turbulent conditions in production.


Even when all of the individual services in a distributed system are functioning properly, the interactions between those services can cause unpredictable outcomes. Unpredictable outcomes, compounded by rare but disruptive real-world events that affect production environments, make these distributed systems inherently chaotic.


Systemic weaknesses could take the form of:

improper fallback settings when a service is unavailable

retry storms from improperly tuned timeouts

outages when a downstream dependency receives too much traffic

cascading failures when a single point of failure crashes


An empirical, systems-based approach addresses the chaos in distributed systems at scale and builds confidence in the ability of those systems to withstand realistic conditions. We learn about the behavior of a distributed system by observing it during a controlled experiment. We call this Chaos Engineering.


CHAOS IN PRACTICE


To specifically address the uncertainty of distributed systems at scale, Chaos Engineering can be thought of as the facilitation of experiments to uncover systemic weaknesses. These experiments follow four steps:


Start by defining ‘steady state’ as some measurable output of a system that indicates normal behavior.

Hypothesize that this steady state will continue in both the control group and the experimental group

Introduce variables that reflect real world events like servers that crash, hard drives that malfunction, network connections that are severed, etc.

Try to disprove the hypothesis by looking for a difference in steady state between the control group and the experimental group.


The harder it is to disrupt the steady state, the more confidence we have in the behavior of the system. 

If a weakness is uncovered, we now have a target for improvement before that behavior manifests in the system at large


ADVANCED PRINCIPLES


Build a Hypothesis around Steady State Behavior

Focus on the measurable output of a system, rather than internal attributes of the system. Measurements of that output over a short period of time constitute a proxy for the system’s steady state. The overall system’s throughput, error rates, latency percentiles, etc. could all be metrics of interest representing steady state behavior. By focusing on systemic behavior patterns during experiments, Chaos verifies that the system does work, rather than trying to validate how it work


Vary Real-world Events

Prioritize events either by potential impact or estimated frequency.

Any event capable of disrupting steady state is a potential variable in a Chaos experiment.


Run Experiments in Production

Since the behavior of utilization can change at any time, sampling real traffic is the only way to reliably capture the request path. To guarantee both authenticity of the way in which the system is exercised and relevance to the current deployed system, Chaos strongly prefers to experiment directly on production traffic.


Automate Experiments to Run Continuously


Minimize Blast Radius

While there must be an allowance for some short-term negative impact, it is the responsibility and obligation of the Chaos Engineer to ensure the fallout from experiments are minimized and contained


Where other practices address velocity and flexibility, Chaos specifically tackles systemic uncertainty in these distributed systems.


https://principlesofchaos.org/


  • Chaos engineering is the practice of testing a system's response to turbulent behavior, such as infrastructure failures, unresponsive services, or missing components.

The goal is to break the system to correct its architecture, understand its weak points, and anticipate failures and how the system and the people might behave


By using the following principles, you can adopt chaos engineering in many difficult environments and organizations. The principles are relevant to all organizations that want to implement chaos engineering and benefit from the high availability and resilience that it enables


Strengthen reliability disciplines

Understand the system

Experiment on every component

Strive for production

Contain the impact

Measure, learn, improve

Increase complexity gradually

Socialize continuously

Sometimes the terminology is the problem, and executives prefer to replace chaos engineering with continuous disaster recovery to promote its adoption


https://www.ibm.com/cloud/architecture/architecture/practices/chaos-engineering-principles/


  • “Chaos Engineering is the discipline of experimenting on a distributed system in order to build confidence in the system’s capability to withstand turbulent conditions in production.” 


For VictorOps, SRE is a scientific practice which aims to make data-driven decisions to improve a system’s reliability and scalability—as observed by the customer.


We knew that all simulated service disruptions were going to be taken in our pre-production environment in order to increase our confidence that it wouldn’t impact users.


What if a service in our staging environment is actually talking to something in our production environment? We are still learning its reality. However, we need to “reduce the blast radius” as they say, so our initial exercises will take place in our pre-production “staging” environment.


This means that we need to ask questions about how we can make staging behave (as closely as possible) to the customer-facing environment. 


Principles of Chaos:


    Build a Hypothesis around Steady State Behavior

    Vary Real-world Events

    Run Experiments in Production

    Automate Experiments to Run Continuously

    Minimize Blast Radius


What is the goal of Chaos Day?


Using the principles of chaos engineering we will learn how our system handles failure, then incorporate that information into future development.


What is the goal of our experiments?


This time around, we’re verifying our first round of Black-box Alerts in our staging environment.


What happens if we actually break Staging in a way which takes longer than a day to fix?


We’re aiming to avoid this with back-out criteria for experiments and reset criteria for bad/overloaded data. If, however, a long recovery time is needed, we’ll communicate this and make arrangements with affected teams.


Chaos Team Roles


Recorder

Documenting as much as possible was the first role we wanted to assign—we needed a recorder


Driver

Someone should be responsible for driving the experiments as well:


Incident Commander (Tech Lead)

A technical lead (typically the council representative) would assume the role of the incident commander to be the main point of contact and to maintain a high-level holistic awareness for the experiments


Commander for the day

In addition to team incident commanders, one engineer played the role of the event I.C., communicating across all experiments throughout the day


https://www.splunk.com/en_us/observability/resources/sre-guide-toc/chaos-engineering.html

  • The core tenets on which SRE works are as follows 

Observability
In order to conduct experiments, one must be able to have deep introspection into the functionalities of the system. 

Experimentation
Tightly define scope, time, and duration of experiments. Choose experiments where the risk/reward ratio is in your favor

Reporting
Chaos Engineers should do deep dives into codebases to determine sources of problems and work with engineers to fix problems and increase reliability. 

Culture
Chaos engineering, like DevOps, is a cultural paradigm shift that provides incentives for engineers to design systems with reliability in mind. 

Chaos Engineering increases reliability and uptime by surgically attacking the infrastructure to detect weak spots, thereby increasing resilience to service degradation.
This is a notch higher than the conventional approach of typical Incident Response – Prevention lifecycle. Experiments are run, data is collected, and fixes are made. Instead of hoping that disaster recovery and failover work as expected
https://www.digitalonus.com/sre-chaos-engineering/

  • The principles of observability turn your systems into inspectable and debuggable crime scenes, and chaos engineering encourages and leverages observability as it seeks to help you pre-emptively discover and overcome system weaknesses.
The Value of Observability
As systems evolve increasingly rapidly, they become more complex and more susceptible to failure. Observability is the key that helps you take on responsibility for systems where you need to be able to interrogate, inspect, and piece together what happened, when, and—most importantly—why. 

“It’s not about logs, metrics, or traces, but about being data driven during debugging and using the feedback to iterate on and improve the product,” Cindy Sridharan writes.

Observability helps you effectively debug a running system without having to modify the system in any dramatic way.

You can think of observability as being a super-set of system management and monitoring, where management and monitoring has traditionally been great at answering closed questions such as, “Is that server responding?” Observability extends this power to encompass answering open questions such as, “Can I trace the latency of a user interaction in real time?”, or, “How successful was a user interaction that was submitted yesterday

Great observability signals help you become a “system detective:” someone who is as able to shine a light on emergent system behavior and shape the mental models of operators and engineers evolving the system.

You are able to grasp, inspect, and diagnose the conditions that are the conditions of a rapidly changing, complex, and sometimes failing system.

The Value of Chaos Engineering

Chaos engineering seeks to surface, explore, and test against system weaknesses through careful and controlled chaos experiments.

Chaos Engineering Encourages and Contributes to Observability

Chaos engineering and observability are closely connected
To confidently execute a chaos experiment, observability must detect when the system is normal and how it deviates from that steady-state as the experiment’s method is executed.

When you detect a deviation from the steady-state, then an unsuspected and unobserved system behavior may have been found by the chaos experiment. At this point the team responsible for the system will be looking to the system’s observability signals to help them unpack the causes and contributing factors to this deviation.


https://www.oreilly.com/library/view/chaos-engineering-observability/9781492051046/ch01.html


  • In the practice of Chaos Engineering, observability plays a key role. Validation of hypothesis, steady state behaviour, simulating real-world events, optimizing blast radius are all those stages of your experiments where observability plays a key role


Sources of Observable Data


The four golden signals in a service mesh, viz. latency, traffic, errors & saturation provide us the fundamental data set used for observations


Traffic can be observed across all three pillars for observability.


Latency is observable by measuring the time difference between request and response and analyzing the distribution of that across various actors like client, server, network, communication protocols, etc. 


Errors provide insights into configuration issues, your application code and broken dependencies.


Saturation provides insights into the utilization and capacity of your resources.


Logging is a very granular way of observing the data


Metrics complement logging 


Traces provide a deep understanding of how data flows in your system.


Observability in Action in a Chaos Experiment

Platform: AWS

Target: Microservice deployed in ECS Cluster

Observability: AppDynamics APM

Chaos Tool: Gremlin

Load Generator: HP Performance Center

Attack Type: Network Packet Loss (Egress Traffic)

Blast Radius: 100% (3 out of 3 containers)

Duration: 29 Minutes


Every dependency in a distributed application is its de-facto Chaos Injection Point


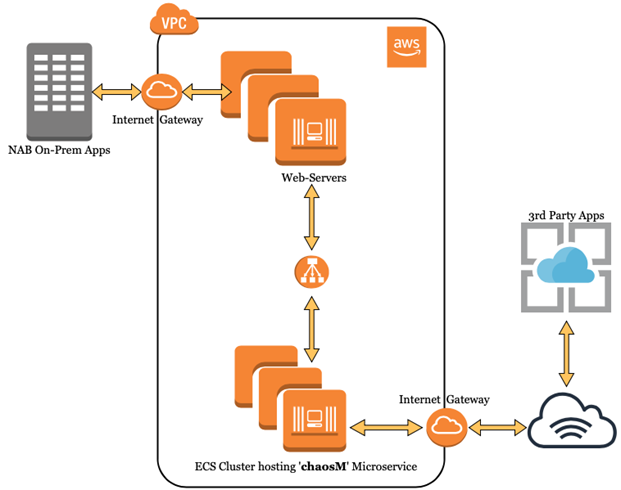
In this article, we specifically demonstrate a scenario of incremental network packet loss for a microservice known as ‘chaosM’ running as part of an AWS ECS cluster


The microservice is running behind a fleet of web-servers. It has 3 task definitions (ECS), balanced across 3 AWS AZs


From a functional view, ‘chaosM’ receives business requests from NAB’s On-Prem Apps, applies the necessary transformation logic before delivering the transformed output to a 3rd-party system, residing outside NAB network


It’s a backend type microservice.


Observed metrics in Steady-state and their deviations in Experiment-state help us validate the hypothesized behaviour of the concerned service.


To observe the steady-state of our micro service, we use metrics called KPIs: Traffic, Errors, Latency & Saturation


our sample ‘chaosM’ micro service is a business integration service designed for data transformation & enrichment. Unlike customer facing services, it does not have business metrics like logins/sec, submission/minute, etc.


Hypothesis


Based on the service’s observability, we make a couple of hypothesis about the microservice:


The incremental Packet Loss attacks of 40%, 60% & 80%, which tries to simulate varying degree of network reliability, will result in a steady increase in latency along with its corresponding error rates (HTTP 500 in this case).

At 100% Packet Loss (a.k.a Blackhole), which simulates a downstream outage, we should be able to validate a 5 sec TCP connect timeout as configured in the ‘chaosM’ microservice


Gremlin’s Failure-as-a-Service (FaaS) Platform is used to design & launch the scenario where we execute 4 incremental network packet loss attacks with increasing intensity i.e. 40%, 60%, 80% & 100% packet loss 


Each attack lasts 3 minutes. Also, a 3-minute delay is kept between each successive attack to isolate the observations and allow the service to fall back to steady state between each attack.


Therefore, the total attack window is (3 mins duration x 4 attacks) + (3 mins delay x 3) = (12 + 9) = 21 minutes.


In our observations, we also take into consideration 4 mins before & after the experiment. Hence, total observation window is 29 minutes


The experiment state dashboard represents the same KPIs which helps understand the behaviour of the ‘chaosM’ micro service when it is under attack. We will perform a comparative analysis between steady-state and experiment-state to validate the hypothesis.


Comparative Analysis

The technical insights generated out of the comparative analysis objectively identifies potential weaknesses (in design, coding & configurations) in the system with respect to specific categories of failures


Chaos Engineering experiments do not necessarily make your service totally immune to outages. On the contrary, among many other things, they help you uncover the known-unknowns to validate the robustness of your services.


Latency & Traffic

For the ease of comparison, we have put the SLIs from Steady and Experiment States side-by-side


This rise in Latency is proportional to the magnitude of the Packet Loss attacks, which validates our first hypothesis.

This validates our second hypothesis.


Errors per minute metric has increased exponentially from 0 Error in Steady State to 8 Errors at 40% Packet Loss, 18 Errors at 60% and 56 Errors at 80% Packet Loss


Saturation: CPU, Memory


In Steady state, the CPU utilization metric was reporting 1% across all 3 containers. The same metric in Experiment state has gone up to 2% irrespective of the magnitude of Packet loss.

Experiment has hardly made any difference to memory utilization


Saturation: Network


While the incoming metric shows 300~400 KB/s of incoming data, the corresponding network outgoing metric shows 8000 KB/s during the same time window. Due to these observations, we also concluded that unreliable network, in this case, does not affect resource utilization of our container infrastructure


Observability for a Developer


However, these metrics sometimes show the symptoms of the issue and not necessarily its underlying cause.


An APM monitoring solution can give us insights about the target micro service at the code level & exposes the vulnerable code segments, if any, from a Developer’s perspective.


The code segment Spring Bean — chaosMethod:416 took 38,805 ms or 38.8 Seconds in Experiment State which represents 99.8% of the total execution time. Whereas the same code segment only took 269 ms in Steady State. The 38.8 seconds represents the impact of the packet loss attacks on the code segment Spring Bean — chaosMethod:416.


This code level insights along with the system level visibility coming out of a monitoring (AppDynamics) helps us understand the internal workings of a micro service under various stress conditions & failure scenarios simulated through Chaos Engineering experiments


Observability is only of value when you better understand the data. When you look inside and answer the ‘whys’. You can find answers for both Operators and Developers.


You can discover the known-unknowns and unknown-unknowns once you conduct experiments on your hypothesis.

https://medium.com/@nabtechblog/observability-in-the-realm-of-chaos-engineering-99089226ca51


  • The prevailing wisdom is that you will see failures in production; the only question is whether you'll be surprised by them or inflict them intentionally to test system resilience and learn from the experience. The latter approach is chaos engineering.


The idea of the chaos-testing toolkit originated with Netflix’s Chaos Monkey and continues to expand. Today many companies have adopted chaos engineering as a cornerstone of their site reliability engineering (SRE) strategy


https://techbeacon.com/app-dev-testing/chaos-engineering-testing-34-tools-tutorials

Monday, November 1, 2021

open source security

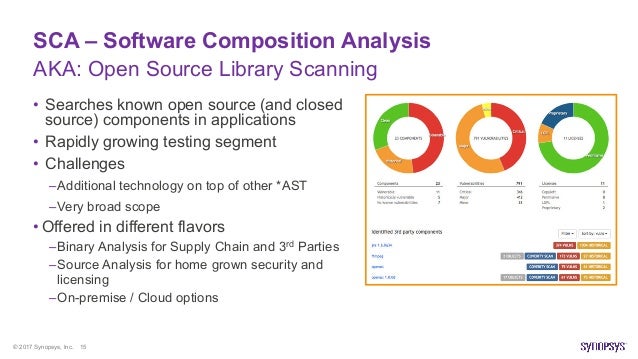
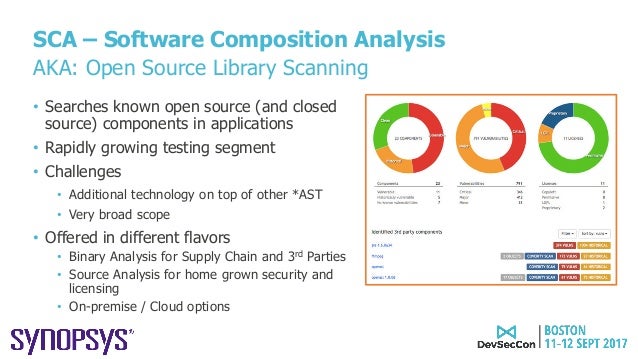
  • software composition analysis (SCA) SCA, a term coined by market analysts, describes an automated process to identify open source components in a codebase. Once a component is identified, it becomes possible to map that component to known security disclosures and determine whether multiple versions are present within an application. SCA also helps identify whether the age of the component might present maintenance issues. While not strictly a security consideration, SCA also facilitates legal compliance related to those open source components. While development and security teams often use SAST (static application security testing) and SCA solutions to identify security weaknesses and vulnerabilities in their web applications, detection of many vulnerabilities is only possible by dynamically testing the running application, which led to the development of dynamic application security testing (DAST) tools. Despite similarities to traditional DAST and penetration testing tools, IAST is superior to both in finding vulnerabilities earlier in the software development life cycle (SDLC)—when it is easier, faster, and cheaper to fix them. Over time, IAST is likely to displace DAST usage for two reasons: IAST provides significant advantages by returning vulnerability information and remediation guidance rapidly and early in the SDLC, and it can be integrated more easily into CI/CD and DevOps workflows. https://www.synopsys.com/blogs/software-security/iast-sca-security-toolkit/ 

  • Component Analysis is the process of identifying potential areas of risk from the use of third-party and open-source software and hardware components. Component Analysis is a function within an overall Cyber Supply Chain Risk Management (C-SCRM) framework. A software-only subset of Component Analysis with limited scope is commonly referred to as Software Composition Analysis (SCA). https://www.owasp.org/index.php/Component_Analysis
  • Software Composition Analysis (SCA) platform that keeps track of all third-party components used in all the applications an organization creates or consumes. It integrates with multiple vulnerability databases including the National Vulnerability Database (NVD), Node Security Platform (NSP), and VulnDB from Risk Based Security.


  • Dependency-Check is a Software Composition Analysis (SCA) tool that attempts to detect publicly disclosed vulnerabilities contained within a project’s dependencies.

https://owasp.org/www-project-dependency-check/
  • What is Open Source Security?
Open Source Security, commonly referred to as Software Composition Analysis (SCA), is a methodology to provide users better visibility into the open source inventory of their applications.

What is Open Source?
Open source refers to any software with accessible source code that anyone can modify and share freely.

Why Use Open Source Software?
Open Source Software (OSS) is distributed freely, making it very cost-effective. Many developers benefit by starting with OSS and then tweaking it to suit their needs. Since the code is open, it's simply a matter of modifying it to add the functionality they want.

Is Open Source a Security Risk?
Open source components are not created equal. Some are vulnerable from the start, while others go bad over time
Usage has become more complex. With tens of billions of downloads, it’s increasingly difficult to manage libraries and direct dependencies
Transitive dependencies: if you are using dependency management tools like Maven (Java), Bower (JavaScript), Bundler (Ruby), etc., then you are automatically pulling in third party dependencies – a liability that you can’t afford.

https://www.microfocus.com/en-us/what-is/open-source-security


  • Open Source Security Foundation (OpenSSF) 
Concise Guide for Developing More Secure Software

Ensure all privileged developers use multi-factor authentication (MFA) tokens. This includes those with commit or accept privileges. MFA hinders attackers from “taking over” these accounts.

Use a combination of tools in your CI pipeline to detect vulnerabilities.

Evaluate software before selecting it as a direct dependency. Only add it if needed, evaluate it (see Concise Guide for Evaluating Open Source Software, double-check its name (to counter typosquatting), and ensure it’s retrieved from the correct repository.

Use package managers. Use package managers (system, language-level, and/or container-level) to automatically manage dependencies and enable rapid updates.

Implement automated tests. Include negative tests (tests that what shouldn’t happen doesn’t happen) and ensure the test suite is thorough enough to “ship if it passes the tests”

Monitor known vulnerabilities in your software’s direct & indirect dependencies. E.g., enable basic scanning via GitHub’s dependabot or GitLab dependency scanning. Many other third party Software Composition Analysis (SCA) tools are also available. Quickly update vulnerable dependencies.

Keep dependencies reasonably up-to-date

Do not push secrets to a repository. Use tools to detect pushing secrets to a repository.

Review before accepting changes. Enforce it, e.g., GitHub or GitLab protected branches.

Improve your OpenSSF Scorecards score (if OSS and on GitHub). You can read the Scorecards checks. Use the Allstar monitor.

Improve your Supply chain Levels for Software Artifacts (SLSA) level. This hardens the integrity of your build and distribution process against attacks.


Publish and consume a software bill of materials (SBOM). This lets users verify inventory, id known vulnerabilities, & id potential legal issues. Consider SPDX or CycloneDX.

Onboard your project into LFX Security if you manage a Linux Foundation project.
Apply the CNCF Security TAG Software Supply Chain Best Practices guide.
Implement ASVS and follow relevant cheatsheets.
Apply SAFECode’s Fundamental Practices for Secure Software Development.

https://best.openssf.org/Concise-Guide-for-Developing-More-Secure-Software

  • Guide to Security Tools

Two main tool categories

There are two main technical categories of verification tools:

    Static analysis is any approach for verifying software (including finding defects) without executing software. This includes tools that examine source code looking for vulnerabilities (e.g., source code vulnerability scanning tools). It also includes humans reading code, looking for problems.
    Dynamic analysis is any approach for verifying software (including finding defects) by executing software on specific inputs and checking the results. Traditional testing is a kind of dynamic analysis. Fuzz testing, where you send many random inputs to a program to see if it does something it should not, is also an example of dynamic analysis.


Types of Tools

This section will cover some of the most common application security tools including linters, SAST, SCA, DAST, Fuzzers, Hard Coded Secrets Detectors, and SBOM generators.

Quality scanners (linters)

Quality scanners, also called "linters", examine source code, byte code, or machine code to look for generic “quality” problems. For example, they may look for misleading indentation, combinations of constructs that usually indicate a defect, or overly-long methods that may be hard to understand later. There are a large variety of these, including style checkers and external type checkers.

For our purposes we will include compiler warning flags in this category.

These tools often don’t focus on security, but using them can still help improve security:

Security Code Scanners (Static Application Security Testing (SAST) Tools)

Some tools analyze code specifically looking for vulnerabilities. They go by a variety of names, such as security code scanners, Static Application Security Testing (SAST) tools, security source code scanners (if they examine source code), binary code scanners (if they only examine executables), or sometimes just static code analyzers. Some people use the term SAST only when the tool analyzes source code.

Secret scanning tools

Secret scanning tools look for secrets (passwords, stored keys, etc.), typically in a repository's code and/or configuration. These are typically static analysis tools. These tools typlically detect the secrets in code by grepping (simple text based searching) or regex searches.

Software Bill Of Materials (SBOM) tools

A Software Bill Of Materials (SBOM) is an artifact that may accompany the release of a software package. The SBOM includes an inventory of the software components and dependencies that are included in a parent software. This may include both open source and proprietary components and dependencies. It may also include additional information such as more in-depth package information, file information, licensing, authors, contributors, security checksums or references, copyright information, as well as their hierarchical relationships.

Machine-readable formats for SBOMs grant the opportunity for this information to be shared throughout the software supply chain; thus increasing transparency of and confidence in the final delivered software artifact. The machine readable formats for SBOMs currently include SPDX, CycloneDX, and SWID.

SBOMs are quickly becoming a necessity for software products and services to include in their software delivery practices. SBOMs are being recommended by several security frameworks, organizations, and security requirements such as the White House Executive Order 14028, NIST, NTIA,the OpenSSF Mobilization Plan, and SLSA.

Software Component Analysis (SCA)/Dependency Analysis tools

Software component analysis (SCA) tools, also called dependency analysis or origin analysis tools, determine the reused components used by code (source code or executable). To be security-relevant, these tools also determine which of those reused components have publicly-known vulnerabilities (CVEs).

Dependency Updating & Hygiene Tools

SCA tools help identify the known vulnerable OSS components used in your project, but other tools exist to help ensure that OSS hygiene becomes an automated process. As required in the OpenSSF Secure Supply Chain Consumption Framework (S2C2F) maturity level 2, tools such as Dependabot or Renovate bot will auto-submit Pull Requests (PRs) to update your known-vulnerable dependencies. All a developer has to do is choose to accept the PR to keep their dependencies up-to-date.

Fuzzers

A fuzzer is a tool that implements a dynamic analysis approach called fuzz testing or fuzzing. In fuzz testing, you generate a large number of inputs, run the program, and see if the program behaves badly (e.g., crashes or hangs). A key aspect of fuzzing is that it does not generally check if the program produces the correct answer; it just checks that certain reasonable behavior (like “does not crash”) occurs

Web Application Scanner

A web application scanner (WAS), also called a web application vulnerability scanner, essentially pretends it is a simulated user or web browser and tries to do many things to detect problems. Think of a WAS as a frenetic and malicious web browser user; the WAS will try to click on every button it finds, enter bizarre text into every text field it finds, and so on. In short, it attempts simulated attacks and odd behavior to try to detect problems. This means that WASs often build on fuzzers internally, but they are specifically designed to analyze web applications.

There are many of these tools. OSS tools include OWASP ZAP, W3AF, IronWASP, Skipfish, and Wapiti. Proprietary tools include IBM AppScan, HP WebInspect, and Burp Suite Pro. If you have no idea, you might check out OWASP ZAP at least; it is easy to use, and it can find many things. But tools change over time, and it is best to look at your options before picking one (or several).

The term Dynamic Application Security Testing, or DAST, is often seen in literature. However, the meaning of DAST has a lot of variation:

    For some, DAST is dynamic analysis for finding vulnerabilities in just web applications, making DAST the same as a web application scanner.
    For others, DAST includes web application scanners and fuzzers for programs other than web applications.


https://github.com/ossf/wg-security-tooling/blob/main/guide.md#readme

  • About secret scanning
 your project communicates with an external service, you might use a token or private key for authentication. Tokens and private keys are examples of secrets that a service provider can issue. If you check a secret into a repository, anyone who has read access to the repository can use the secret to access the external service with your privileges. We recommend that you store secrets in a dedicated, secure location outside of the repository for your project.

Secret scanning will scan your entire Git history on all branches present in your GitHub repository for secrets. 
https://docs.github.com/en/code-security/secret-scanning/about-secret-scanning


Thursday, October 25, 2018

Dynamic Application Security Testing (DAST)

  • DAST

Web Application Vulnerability Scanners are automated tools that scan web applications, normally from the outside, to look for security vulnerabilities such as Cross-site scripting, SQL Injection, Command Injection, Path Traversal and insecure server configuration. This category of tools is frequently referred to as Dynamic Application Security Testing (DAST) Tools.

Tools Listing
Acunetix WVS
AppTrana Basic
Arachni
AVDS
Burp Suite
Grabber
Grendel-Scan
GoLismero
ImmuniWeb
Nexpose
Nikto
Vega
Wapiti
WebCookies
Wikto
w3af
Zed Attack Proxy - OWASP ZAP

https://www.owasp.org/index.php/Category:Vulnerability_Scanning_Tools


  • Dynamic Application Security Testing (DAST)

Dynamic application security testing (DAST) technologies are designed to detect conditions indicative of a security vulnerability in an application in its running state. Most DAST solutions test only the exposed HTTP and HTML interfaces of Web-enabled applications; however, some solutions are designed specifically for non-Web protocol and data malformation (for example, remote procedure call, Session Initiation Protocol [SIP] and so on).
http://www.gartner.com/it-glossary/dynamic-application-security-testing-dast/


  • Today’s organizations deploy a myriad of web applications, ranging from external-facing corporate websites to internal-facing portals.WhiteHat Sentinel Dynamic is a Software-as-a-Service platform for dynamic application security testing (DAST).

https://www.whitehatsec.com/products/dynamic-application-security-testing/

  • Application security can help organizations protect all kinds of applications (such as legacy, desktop, web, mobile, micro services) used by internal and external stakeholders including customers, business partners and employees

Why Application Security?
As validated by multiple studies, the majority of successful breaches target exploitable vulnerabilities residing in the application layer, indicating the need for enterprise IT departments to be extra vigilant about application security.Now, the software supply chain is much more complicated considering the outsourced development, the number of legacy applications, coupled with in-house development that takes advantage of 3rd party, open source and commercial, off-the-shelf software components.
Organizations need application security solutions that cover all of their applications, from those used internally to popular external apps used on customers’ mobile phones.
These solutions must cover the entire development stage and offer testing after an application is put into use to monitor for potential problems.

What is SAST?
Static Application Security Testing (SAST) scans the application source files, accurately identifies the root cause and helps remediate the underlying security flaws.
Developer Benefits of Static Application Security Testing:
Fully integrated with the Integrated Developer Environment (IDE)

What is DAST?
Dynamic Application Security Testing (DAST) simulates controlled attacks on a running web application or service to identify exploitable vulnerabilities in a running environment.
Benefits of Dynamic Application Security Testing:
    Provides a comprehensive view of application security by focusing on what’s exploitable and covering all components (server, custom code, open source, services)
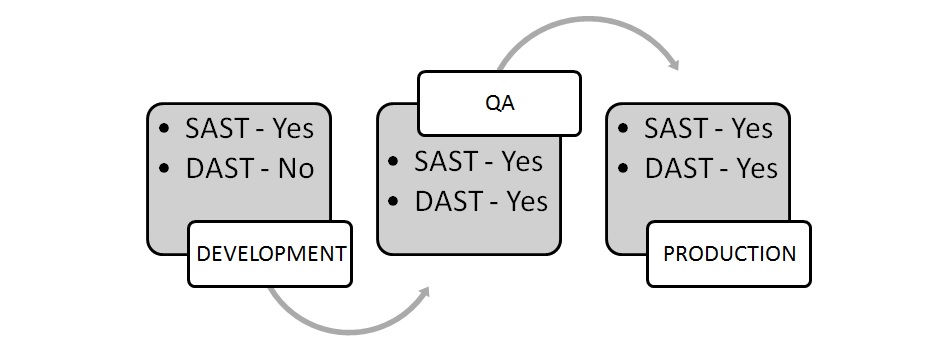
Can be integrated into Dev, QA and Production to offer a continuous holistic view
Tests functional app, so unlike SAST, is not language constrained and runtime and environment-related issues can be discovered
https://www.microfocus.com/en-us/what-is/application-security

  • What is Dynamic Application Security Testing (DAST)?
Dynamic Application Security Testing (DAST) is the process of analyzing a web application through the front-end to find vulnerabilities through simulated attacks.This type of approach evaluates the application from the “outside in” by attacking an application like a malicious user would. 

Pros of DAST
    Independent of the application
    Immediately finds vulnerabilities that could be exploited
    Does not require access to the source code
Cons of DAST
    Does not find the exact location of a vulnerability in the code
    Security knowledge is needed to interpret reports
    Test can be time-consuming

There are many ways to test application security, including:
    Static Application Security Testing (SAST)
    Dynamic Application Security Testing (DAST)
    Mobile Application Security Testing (MAST)
    Interactive Application Security Testing (IAST)

Why is DAST Important?
Human error will inevitably play a part at some point in the Software Development Life Cycle (SDLC), and the sooner a vulnerability is caught during the SDLC, the cheaper it is to fix.
When DAST is included as part of the Continuous Integration/Continuous Development (CI/CD) pipeline, this is referred to as “Secure DevOps,” or “DevSecOps.”

How does DAST work?
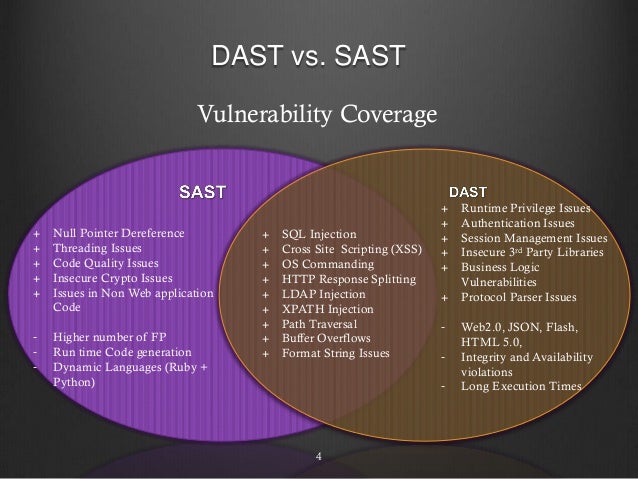
A DAST scanner searches for vulnerabilities in a running application and then sends automated alerts if it finds flaws that allow for attacks like SQL injections, Cross-Site Scripting (XSS), and more. Since DAST tools are equipped to function in a dynamic environment, they can detect runtime flaws which SAST tools can’t identify.

What is the difference between SAST and DAST?
SAST, on the other hand, analyzes static environments, meaning the source code of an application. It looks at the application from the “inside out,” searching for vulnerabilities in the code.
To maximize the strength of your security posture, it’s a best practice to use both SAST and DAST. Having this unified taxonomy across testing methods enables you to have a complete view of vulnerabilities.

https://www.microfocus.com/en-us/what-is/dast

  • ZAPGETTINGSTARTEDGUIDE-2.7

Software security testing is the process of assessing and testing a system to discover security risks and vulnerabilities of the system and its data.
we defne assessments as the analysis and discovery of vulnerabilities without attempting to actually exploit those vulnerabilities.
At its core, ZAP is what is known as a “man-in-the-middle proxy.”
It stands between the tester’s browser and the web application so that it can intercept and inspect messages sent between browser and web application, modify the contents if needed, and then forward those packets on to the destination.
It can be used as a stand-alone application, and as a daemon process.
When you frst start ZAP, you will be asked if you want to persist the ZAP session. By default,ZAP sessions are always recorded to disk in a HSQLDB database with a default name and
location. If you do not persist the session, those fles are deleted when you exit ZAP If you choose to persist a session, the session information will be saved in the local database so you can access it later, and you will be able to provide custom names and locations for
saving the fles.

Expand Your Pentesting with ZAP
Any pages protected by a login page are not discoverable during a passive scan because, unless you’ve confgured ZAP’s authentication functionality, ZAP will not
handle the required authentication Any pages that are not fndable with ZAP’s default spider are not testable during a passive scan. ZAP does provide additional options for discovery and coverage outside
of passive scanning.

Quick Scan uses the traditional ZAP spider, which discovers links by examining the HTML in responses from the web application. This spider is fast, but it is not
always effective when exploring an AJAX web application that generates  links using JavaScript.

Spiders are a great way to explore your basic site, but they should be combined with manual exploration to be more effective.
Spiders, for example, will only enter basic default data into forms in your web application but a user can enter more relevant information which can, in
turn, expose more of the web application to ZAP.
This is especially true with things like
registration forms where a valid email address is required. The spider may enter a random string, which will cause an error. A user will be able to react to that error and supply a
correctly formatted string, which may cause more of the application to be exposed when the form is submitted and accepted.
Obscurity is not security, and hidden pages sometimes go live without warning or notice. So be as thorough as you can when exploring your site.

Passive scanning is good at fnding some vulnerabilities and as a way to get a feel for the basic security state of a web application and locate where more investigation may be warranted
Active scanning, however, att empts to fnd other vulnerabilities by using known attacks against the selected targets.

  • The OWASP Top Ten Proactive Controls 2016 is a list of security techniques that should be included in every software development project
Verify for Security Early and Often
Parameterize Queries
Encode Data
Validate All Inputs
Implement Identity and Authentication Controls
Implement Appropriate Access Controls
Protect Data
Implement Logging and Intrusion Detection
Leverage Security Frameworks and Libraries
Error and Exception Handling
https://www.owasp.org/index.php/OWASP_Proactive_Controls

  • OWASP OWTF
OWTF aims to make pen testing:
    Aligned with OWASP Testing Guide + PTES + NIST
https://www.owasp.org/index.php/OWASP_OWTF

  • Vega is a free and open source web security scanner and web security testing platform to test the security of web applications. Vega can help you find and validate SQL Injection, Cross-Site Scripting (XSS), inadvertently disclosed sensitive information, and other vulnerabilities
https://subgraph.com/vega/ 


  • Arachni is a feature-full, modular, high-performance Ruby framework aimed towards helping penetration testers and administrators evaluate the security of modern web applications
http://www.arachni-scanner.com/ 


  • w3af is a Web Application Attack and Audit Framework. The project’s goal is to create a framework to help you secure your web applications by finding and exploiting all web application vulnerabilities.W3af is known as most powerful and flexible tool for finding web application’s vulnerability. It’s easy to use feature made it popular among the security professionals like ethical hackers. W3af contains many web assessment and exploitation plugins as well.

http://w3af.org/


  • Nikto is an Open Source (GPL) web server scanner which performs comprehensive tests against web servers for multiple items, including over 6400 potentially dangerous files/CGIs, checks for outdated versions of over 1200 servers, and version specific problems on over 270 servers .Nikto is sponsored by Netsparker, a false positive free web application security scanner.

https://cirt.net/Nikto2


  • Burp Suite is an integrated platform for performing security testing of web applications
    https://portswigger.net/burp/


    •  Spider - This can be used for automatically crawling an application, to discover its content and functionality.    Scanner - This is used to automatically scan HTTP requests to find security vulnerabilities.

        Intruder - This allows you to perform customized automated attacks, to carry out all kinds of testing tasks.
        Repeater - This is used to manually modify and reissue individual HTTP requests over and over.
        Sequencer - This is used to analyze the quality of randomness in an application's session tokens.
        Decoder - This lets you transform bits of application data using common encoding and decoding schemes.
        Comparer - This is used to perform a visual comparison of bits of application data to find interesting differences.


    https://portswigger.net/burp/help/suite_gettingstarted


    • Firefox - Go to the Firefox menu, click on Options, click on Advanced, go to the Network tab, and click on the Settings button in the Connection section. Select the "Manual proxy configuration" radio button. Enter your Burp Proxy listener address in the "HTTP proxy" field (by default, 127.0.0.1). Enter your Burp Proxy listener port in the "Port" field (by default, 8080). Make sure the "Use this proxy server for all protocols" box is checked. Delete anything that appears in the "No proxy for" field. Then click "OK" to close all of the options dialogs.

    https://portswigger.net/burp/help/suite_gettingstarted#browser

    The intercept feature will intercept ALL traffic sent from the browser, additional extensions such as FoxyProxy can be used to specify which URLs and IPs are blacklisted/whitelisted and therefore bypass the Burp intercept.


    http://www.primalsecurity.net/0x2-exploit-tutorial-web-hacking-with-burp-suite/
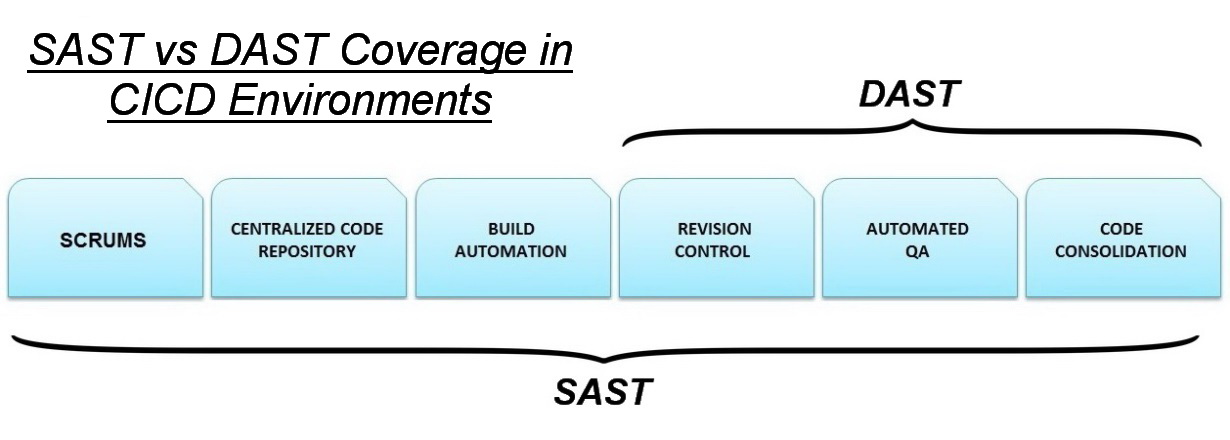
    • Two ways to go about this are static application security testing (SAST) and dynamic application security testing (DAST). These application security testing methodologies are used to find the security vulnerabilities that make your organization’s applications susceptible to attack.The two methodologies approach applications very differently. They are most effective at different phases of the software development life cycle (SDLC) and find different types of vulnerabilities. For example, SAST detects critical vulnerabilities such as cross-site scripting (XSS), SQL injection, and buffer overflow earlier in the SDLC. DAST, on the other hand, uses an outside-in penetration testing approach to identify security vulnerabilities while web applications are running.
    https://www.cigital.com/blog/sast-vs-dast
    • SAST vs DAST 


    • SAST, DAST, IAST, and RASP: Pros, cons and how to choose


    Some organizations need to focus on their developers, adding static application security testing (SAST) to the development cycle to catch potential flaws early
    Other organizations may want to prove their need by using dynamic application security testing (DAST) or penetration testing to show how vulnerable their applications are.
    there's interactive application security testing (IAST), which uses agents and additional software libraries to collect data from running applications that can then reveal vulnerabilities.
    Companies that want to “virtually patch” their applications can lock down their portfolios using some form of application firewall or a newer technology, such as runtime application self-protection (RASP), a form of IAST.

    IAST, including RASP: Protect code against exploits and known bugs
    a new approach—known as interactive application security testing (IAST), or “glass-box” testing—promises to catch attacks that the other approaches miss
    IAST runs as an agent, allowing you to collect and analyze event data from running applications.

    https://learn.techbeacon.com/units/sast-dast-iast-rasp-pros-cons-how-choose


    • Fiddler
    Use Fiddler for security testing your web applications -- decrypt HTTPS traffic, and display and modify requests using a man-in-the-middle decryption technique. Configure Fiddler to decrypt all traffic, or only specific sessions.
    http://www.telerik.com/fiddler

    • paros
    A Java-based web proxy for assessing web application vulnerability. It supports editing/viewing HTTP/HTTPS messages on-the-fly to change items such as cookies and form fields. It includes a web traffic recorder, web spider, hash calculator, and a scanner for testing common web application attacks such as SQL injection and cross-site scripting
    http://sectools.org/tool/paros/
    • Odysseus
    Odysseus is a proxy server, which acts as a man-in-the-middle during an HTTP session. A typical HTTP proxy will relay packets to and from a client browser and a web server. Odysseus will intercept an HTTP session’s data in either direction and give the user the ability to alter the data before transmission.
    http://www.darknet.org.uk/2007/02/odysseus-win32-proxy-telemachus-http-transaction-analysis/

    • Charles is an HTTP proxy / HTTP monitor / Reverse Proxy that enables a developer to view all of the HTTP and SSL / HTTPS traffic between their machine and the Internet.

    https://www.charlesproxy.com/
    • Application Security Automation
    Glue is a framework for running a series of tools. Generally, it is intended as a backbone for automating a security analysis pipeline of tools.
    https://github.com/OWASP/glue

    • OWASP Glue Tool Project
    The purpose of the project is to make it easy to integrate security tools (like static or dynamic analysis) into the CI/CD pipeline.
    https://www.owasp.org/index.php/OWASP_Glue_Tool_Project

    • What is BeEF?

    BeEF is short for The Browser Exploitation Framework. It is a penetration testing tool that focuses on the web browser.
    including mobile clients, BeEF allows the professional penetration tester to assess the actual security posture of a target environment by using client-side attack vectors. Unlike other security frameworks, BeEF looks past the hardened network perimeter and client system, and examines exploitability within the context of the one open door: the web browser
    https://beefproject.com/

    • OWASP Application Security Verification Standard Project

    The OWASP Application Security Verification Standard (ASVS) Project provides a basis for testing web application technical security controls and also provides developers with a list of requirements for secure development.
    https://www.owasp.org/index.php/Category:OWASP_Application_Security_Verification_Standard_Project


    • Free for Open Source Application Security Tools

    the following lists of automated vulnerability detection tools that are free for open source projects
        Static Application Security Testing (SAST) Tools
        Dynamic Application Security Testing (DAST) Tools - (Primarily for web apps)
        Interactive Application Security Testing (IAST) Tools - (Primarily for web apps and web APIs)
        Keeping Open Source libraries up-to-date (to avoid Using Components with Known Vulnerabilities (OWASP Top 10-2017 A9))
        Static Code Quality Tools
    • https://www.owasp.org/index.php/Free_for_Open_Source_Application_Security_Tools
    • Software Assurance Maturity Model

    The Software Assurance Maturity Model (SAMM) is an open framework to help organizations formulate and implement a strategy for software security that is tailored to the specific risks facing the organization
    https://www.opensamm.org/

    Overview of Burp Suite

    DAST (Dynamic Application Security Testing) / Penetration Testing Tool
    Integrated platform for performing security testing of web apps
    Developed to provide comprehensive solution for web app security checks.Functionality includes proxy server, scanner, intruder, spidering, a repeater, a decoder,comparer, an extender, and sequence

    Desired an automated approach to running Burp Suitesecurity scanning
    Manual security scanning is time consuming (bottleneck) due to applicationdiscovery/ crawling process

    Used Automated UI tests for application discovery
    Used protractor (selenium) UI automated tests to act as the event based trigger forapplication discovery while using Burp Proxy to intercept all Requests/Response
    Used Jenkins (Cl/CD) to run the automated UI test

    Burp Suite Professional (v.1.7.34) with 'Burp-REST-API
    Automated the spidering, proxy, intercepts request/response from UI tests, thenkicks off security scan, then generates Burp security scan report

    Development Frivironment
    Angular/NodeJS Web application
    Protractor/Jasmine — Automated UI tool
    Jenkins Cl/CD pipeline
    Burp Suite Faternal API

    Using multiple approach to testing applications
    Manual Penetration Testing
    DAST (Web App Scanning Tools)
    Burp
    Accunetix
    Netsparker
    SAST (DevSecOps Tools)
    Checkmarx
    Fortify
    SonarQube
    https://www.osti.gov/servlets/purl/1639985