Monday, June 15, 2020

container runtimes


  • Container Runtime


A container runtime a lower level component typically used in a Container Engine but can also be used by hand for testing. The Open Containers Initiative (OCI) Runtime Standard reference implementation  is runc. This is the most widely used container runtime, but there are others OCI compliant runtimes, such as crun, railcar, and katacontainers. Docker, CRI-O, and many other Container Engines rely on runc.

Kernel Namespace
When discussing containers, Kernel namespaces are perhaps the most important data structure, because they enable containers as we know them today. Kernel namespaces enable each container to have it’s own mount points, network interfaces, user identifiers, process identifiers, etc.
When you type a command in a Bash terminal and hit enter, Bash makes a request to the kernel to create a normal Linux process using a version of the exec() system call. A container is special because when you send a request to a container engine like docker, the docker daemon makes a request to the kernel to create a containerized process using a different system call called clone(). This clone() system call is special because it can create a process with its own virtual mount points, process ids, user ids, network interfaces, hostname, etc

https://developers.redhat.com/blog/2018/02/22/container-terminology-practical-introduction/#h.6yt1ex5wfo55


  • In computer programming, a runtime system, also called runtime environment, primarily implements portions of an execution model.Most programming languages have some form of runtime system that provides an environment in which programs run. This environment may address a number of issues including the management of application memory, how the program accesses variables, mechanisms for passing parameters between procedures, interfacing with the operating system, and otherwise. The compiler makes assumptions depending on the specific runtime system to generate correct code. Typically the runtime system will have some responsibility for setting up and managing the stack and heap, and may include features such as garbage collection, threads or other dynamic features built into the language

https://en.wikipedia.org/wiki/Runtime_system


  • User namespaces allow non-root users to pretend to be the root•Root-in-UserNS can have “fake” UID 0 and also create other namespaces (MountNS, NetNS..) 

https://indico.cern.ch/event/788994/contributions/3307330/attachments/1846774/3030272/CERN_Rootless_Containers__Unresolved_Issues.pdf

Thursday, June 4, 2020

podman buildah lippod Skopeo


  •     Buildah to facilitate building of OCI images

    Skopeo for sharing/finding container images on Docker registries, the Atomic registry, private registries, local directories and local OCI-layout directories.
    Podman for running containers without need for daemon.
    https://computingforgeeks.com/how-to-install-podman-on-ubuntu/


  •  How Docker CLI Works

   
The Docker CLI is a client/server operation and the Docker CLI communicates with the Docker engine when it wants to create or manipulate the operations of a container. This client/server architecture can lead into problems in production because one, you have to start the Docker daemon before Docker CLI comes alive. The Docker CLI then sends an API call to the Docker Engine to launch Open Container Initiative (OCI) Container runtime, in most cases runc, to start the container (projectatomic.io). What this means is that the launched containers are child processes of the Docker Engine.

What is Podman?
What then is Podman? Podman is a daemonless container engine for developing, managing, and running OCI Containers on your Linux System

Docker vs Podman

The major difference between Docker and Podman is that there is no daemon in Podman. It uses container runtimes as well for example runc but the launched containers are direct descendants of the podman process. This kind of architecture has its advantages such as the following:

    Applied Cgroups or security constraints still control the container: Whatever cgroup constraints you apply on the podman command, the containers launched will receive those same constraints directly.
    Advanced features of systemd can be utilized using this model: This can be done by placing podman into a systemd unit file and hence achieving more.

What about Libpod?
Libpod just provides a library for applications looking to use the Container Pod concept, popularized by Kubernetes.
It allows other tools to manage pods/container (projectatomic.io). Podman is the default CLI tool for using this library.
There are other two important Libraries that make Podman possible:
    containers/storage – This library allows one to use copy-on-write (COW) file systems, required to run containers.
    containers/image – This library that allows one to download and install OCI Based Container Images from containers registries like Docker.io, Quay, and Artifactory, as well as many others (projectatomic.io).

A good example is that you can be running a full Kubernetes environment with CRI-O, building container images using Buildah and managing your containers and pods with Podman at the same time (projectatomic.io).

https://computingforgeeks.com/using-podman-and-libpod-to-run-docker-containers/


  • Podman helps users move to Kubernetes

Podman provides some extra features that help developers and operators in Kubernetes environments. There are extra commands provided by Podman that are not available in Docker. If you
are familiar with Docker and are considering using Kubernetes/OpenShift as your container platform, then Podman can help you.
Podman can generate a Kubernetes YAML file based on a running container using podman generate kube. The command podman pod can be used to help debug running Kubernetes pods along with the standard container commands.
You can either build using a Dockerfile using podman build or you can run a container and make lots of changes and then commit those changes to a new image tag

What is Buildah and why would I use it?
Podman does do builds and for those familiar with Docker, the build process is the same. You can either build using a Dockerfile using podman build or you can run a container and make lots of changes and then commit those changes to a new image tag

Buildah can be described as a superset of commands related to creating and managing container images and, therefore, it has much finer-grained control over images. Podman’s build command contains a subset of the Buildah functionality. It uses the same code as Buildah for building.
The most powerful way to use Buildah is to write Bash scripts for creating your images—in a similar way that you would write a Dockerfile.
When Kubernetes moved to CRI-O based on the OCI runtime specification, there was no need to run a Docker daemon and, therefore, no need to install Docker on any host in the Kubernetes cluster for running pods and containers.
Kubernetes could call CRI-O and it could call runC directly.This, in turn, starts the container processes.
However, if we want to use the same Kubernetes cluster to do builds, as in the case of OpenShift clusters, then we needed a new tool to perform builds that would not require the Docker daemon and subsequently require that Docker be installed.
Such a tool, based on the containers/storage and containers/image projects, would also eliminate the security risk of the open Docker daemon socket during builds, which concerned many users

There are a couple of extra things practitioners need to understand about Buildah:
It allows for finer control of creating image layers.
Buildah’s run command is not the same as Podman’s run command.  Because Buildah is for building images, the run command is essentially the same as the Dockerfile RUN command.
Buildah can build images from scratch, that is, images with nothing in them at all.
In fact, looking at the container storage created as a result of a buildah from scratch command yields an empty directory. This is useful for creating very lightweight images that contain only the packages needed in order to run your application.

A good example use case for a scratch build is to consider the development images versus staging or production images of a Java application. During development, a Java application container image may require the Java compiler and Maven and other tools. But in production, you may only require the Java runtime and your packages. And, by the way, you also do not require a package manager such as DNF/YUM or even Bash. Buildah is a powerful CLI for this use case

Now that we had solved the Kubernetes runtime issue with CRI-O and runC, and we had solved the build problem with Buildah, there was still one reason why Docker was still needed on a Kubernetes host: debugging
How can we debug container issues on a host if we don’t have the tools to do it? We would need to install Docker, and then we are back where we started with the Docker daemon on the host. Podman solves this problem.
Podman becomes a tool that solves two problems. It allows operators to examine containers and images with commands they are familiar with using. And it also provides developers with the same tools.
https://developers.redhat.com/blog/2019/02/21/podman-and-buildah-for-docker-users/


When considering how to implement something like this, we considered the following developer and user workflow:

    Create containers/pods locally using Podman on the command line.
    Verify these containers/pods locally or in a localized container runtime (on a different physical machine).
    Snapshot the container and pod descriptions using Podman and help users re-create them in Kubernetes.
    Users add sophistication and orchestration (where Podman cannot) to the snapshot descriptions and leverage advanced functions of Kubernetes
https://developers.redhat.com/blog/2019/01/29/podman-kubernetes-yaml/


  • The main motivation was to move away from the need of having a daemon that requires root access.

Podman, Skopeo and Buildah are a set of tools that you can use to manage and run container images

https://itnext.io/podman-and-skopeo-on-macos-1b3b9cf21e60

Tuesday, June 2, 2020

service mesh


  • What is a Service Mesh? 

a service mesh is a dedicated infrastructure layer for handling service-to-service communication. Although this definition sounds very much like a CNI implementation on Kubernetes, there are some differences. A service mesh typically sits on top of the CNI and builds on its capabilities. It also adds several additional capabilities like service discovery and security.
The components of a service mesh include:

    Data plane - made up of lightweight proxies that are distributed as sidecars. Proxies include NGINX, or envoy; all of these technologies can be used to build your own service mesh in Kubernetes. In Kubernetes, the proxies are run as cycles and are in every Pod next to your application.
    Control plane - provides the configuration for the proxies, issues the TLS certificates authority, and contain the policy managers. It can collect telemetry and other metrics and some service mesh implementations also include the ability to perform tracing.

How is a service mesh useful?
The example shown below illustrates a Kubernetes cluster with an app composed of these services: a front-end, a backend and a database.

What a service mesh provides?

Not all of the services meshes out there have all of these capabilities, but in general, these are the features you gain:

    Service Discovery (eventually consistent, distributed cache)
    Load Balancing (least request, consistent hashing, zone/latency aware)
    Communication Resiliency (retries, timeouts, circuit-breaking, rate limiting)
    Security (end-to-end encryption, authorization policies)
    Observability (Layer 7 metrics, tracing, alerting)
    Routing Control (traffic shifting and mirroring)
    API (programmable interface, Kubernetes Custom Resource Definitions (CRD))
 
Differences between service mesh implementations?
Istio
Has a Go control plane and uses Envoy as a proxy data plane. Istio is a complex system that does many things, like tracing, logging, TLS, authentication, etc. A drawback is the resource hungry control plane
The more services you have the more resources you need to run them on Istio.
AWS App Mesh
still lacks many of the features that Istio has. For example it doesn’t include mTLS or traffic policies.
Linkerd v2
Also has a Go control plane and a Linkerd proxy data plane that is written in Rust.
Linkerd has some distributed tracing capabilities and just recently implemented traffic shifting.
The current 2.4 release implements the Service Mesh Interface (SMI) traffic split API, that makes it possible to automate Canary deployments and other progressive delivery strategies with Linkerd and Flagger.
Consul Connect
Uses a Consul control plane and requires the data plane to managed inside an app. It does not implement Layer 7 traffic management nor does it support Kubernetes CRDs.

How does progressive delivery work with a service mesh?
Progressive delivery is Continuous Delivery with fine-grained control over the blast radius. This means that you can deliver new features of your app to a certain percentage of your user base.
In order to control the progressive deployments, you need the following:
    User segmentation (provided by the service mesh)
    Traffic shifting Management (provided by the service mesh)
    Observability and metrics (provided by the service mesh)
    Automation (service mesh add-on like Flagger)

Canary
A canary is used for when you want to test some new functionality typically on the backend of your application. Traditionally you may have had two almost identical servers: one that goes to all users and another with the new features that gets rolled out to a subset of users and then compared. When no errors are reported, the new version can gradually roll out to the rest of the infrastructure.

https://www.weave.works/blog/introduction-to-service-meshes-on-kubernetes-and-progressive-delivery


  • The Common Attributes of a Service Mesh


In the basic architectural diagram above,
the green boxes in the data plane represent applications,
the blue squares are service mesh proxies,
and the rectangles are application endpoints (a pod, a physical host, etc).
The control plane provides a centralized API for controlling proxy behavior in aggregate.
While interactions with the control plane can be automated (e.g. by a CI/CD pipeline), it’s typically where you–as a human–would interact with the service mesh.

Any service mesh in this guide has certain features

    Resiliency features (retries, timeouts, deadlines, etc)
    Cascading failure prevention (circuit breaking)
    Robust load balancing algorithms
    Control over request routing (useful for things like CI/CD release patterns)
    The ability to introduce and manage TLS termination between communication endpoints
    Rich sets of metrics to provide instrumentation at the service-to-service layer


What’s Different About a Service Mesh?
The service mesh exists to make your distributed applications behave reliably in production.
With microservices, service-to-service communication becomes the fundamental determining factor for how your applications behave at runtime.
Application functions that used to occur locally as part of the same runtime instead occur as remote procedure calls being transported over an unreliable network.

Product Comparisons
Linkerd
Built on Twitter’s Finagle library, Linkerd is written in Scala and runs on the JVM
Linkerd includes both a proxying data plane and the Namerd (“namer-dee”) control plane all in one package.
Notable features include:

    All of the “table stakes” features (listed above),
    Support for multiple platforms (Docker, Kubernetes, DC/OS, Amazon ECS, or any stand-alone machine),
    Built-in service discovery abstractions to unite multiple systems,
    Support for gRPC, HTTP/2, and HTTP/1.x requests + all TCP traffic.
Envoy
It is written as a high performance C++ application proxy designed for modern cloud-native services architectures.
Envoy is designed to be used either as a standalone proxying layer or as a “universal data plane” for service mesh architectures
Specifically on serving as a foundation for more advanced application proxies, Envoy fills the “data plane” portion of a service mesh architecture.
Envoy is a performant solution with a small resource footprint that makes it amenable to running it as either a shared-proxy or sidecar-proxy deployment mode
You can also find Envoy embedded in security frameworks, gateways, or other service mesh solutions like Istio
Notable features include:

    All of the “table stakes” features (when paired with a control plane, like Istio),
    Low p99 tail latencies at scale when running under load,
    Acts as a L3/L4 filter at its core with many L7 filters provided out of the box,
    Support for gRPC, and HTTP/2 (upstream/downstream),
    API-driven, dynamic configuration, hot reloads,
    Strong focus on metric collection, tracing, and overall observability.
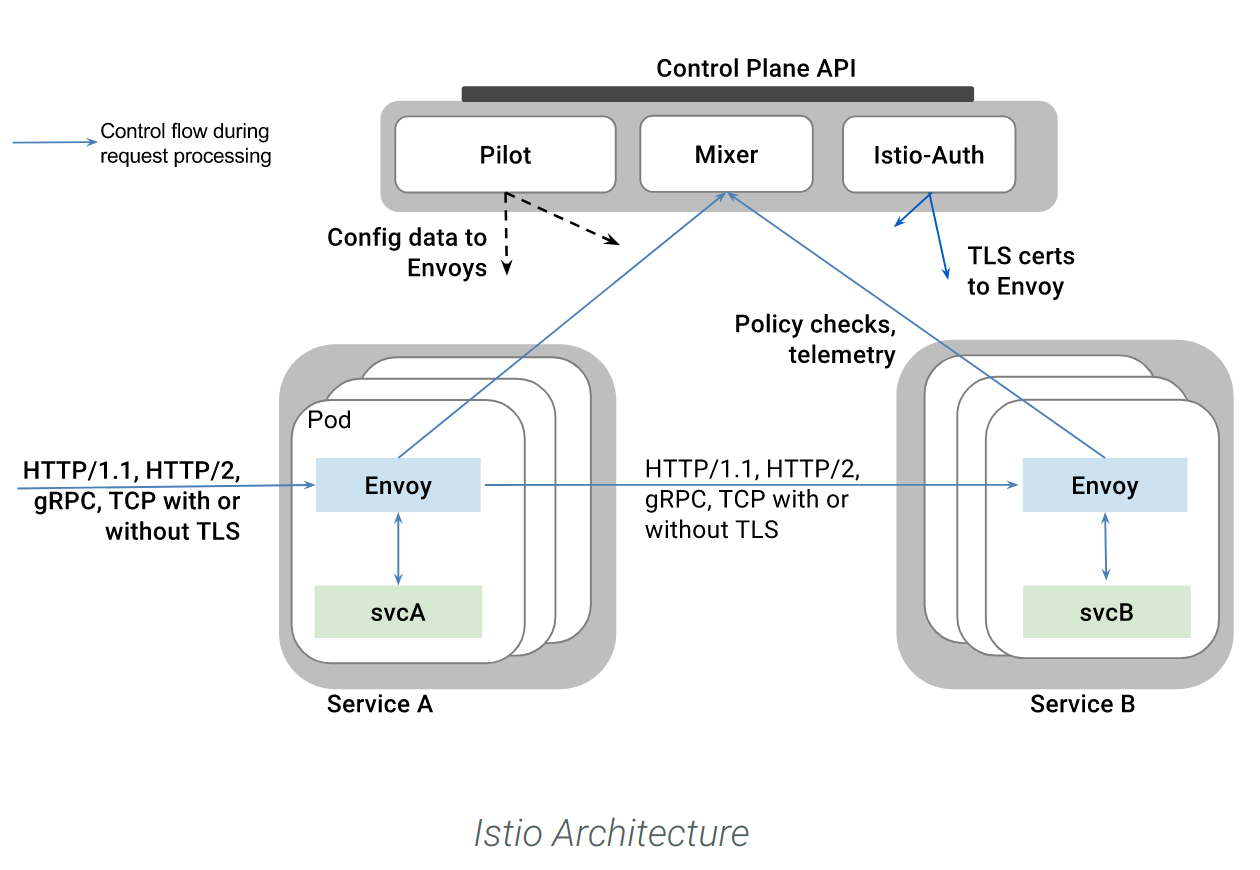
Istio
Istio is designed to provide a universal control plane to manage a variety of underlying service proxies (it pairs with Envoy by default)
Istio initially targeted Kubernetes deployments, but was written from the ground up to be platform agnostic
The Istio control plane is meant to be extensible and is written in Go.
Its design goals mean that components are written for a number of different applications, which is part of what makes it possible to pair Istio with a different underlying data plane, like the commercially-licensed Nginx proxy. Istio must be paired with an underlying proxy.
Notable features include:

    All of the table stakes features (when paired with a data plane, like Envoy),
    Security features including identity, key management, and RBAC,
    Fault injection,
    Support for gRPC, HTTP/2, HTTP/1.x, WebSockets, and all TCP traffic,
    Sophisticated policy, quota, and rate limiting,
    Multi-platform, hybrid deployment.

Conduit
Conduit aims to drastically simplify the service mesh user experience for Kubernetes.
Conduit contains both a data plane (written in Rust) and a control plane (written in Go).

    All of the table stakes features (some are pending roadmap items as of Apr 2018),
    Extremely fast and predictable performance (sub-1ms p99 latency),
    A native Kubernetes user experience (only supports Kubernetes),
    Support for gRPC, HTTP/2, and HTTP/1.x requests + all TCP traffic.
https://thenewstack.io/which-service-mesh-should-i-use/


  • Kubernetes Service Mesh: A Comparison of Istio, Linkerd and Consul

Cloud-native applications are often architected as a constellation of distributed microservices, which are running in Containers.
This exponential growth in microservices creates challenges around figuring out how to enforce and standardize things like routing between multiple services/versions, authentication and authorization, encryption, and load balancing within a Kubernetes cluster.
Building on Service Mesh helps resolve some of these issues, and more. As containers abstract away the operating system from the application, Service Meshes abstract away how inter-process communications are handled.

What is Service Mesh
The thing that is most crucial to understand about microservices is that they are heavily reliant on the network.
Service Mesh manages the network traffic between services.
It does that in a much more graceful and scalable way compared to what would otherwise require a lot of manual, error-prone work and operational burden that is not sustainable in the long-run.
service mesh layers on top of your Kubernetes infrastructure and is making communications between services over the network safe and reliable.

Service mesh allows you to separate the business logic of the application from observability, and network and security policies. It allows you to connect, secure, and monitor your microservices.

    Connect: Service Mesh enables services to discover and talk to each other. It enables intelligent routing to control the flow of traffic and API calls between services/endpoints. These also enable advanced deployment strategies such as blue/green, canaries or rolling upgrades, and more.
    Secure: Service Mesh allows you secure communication between services. It can enforce policies to allow or deny communication. E.g. you can configure a policy to deny access to production services from a client service running in development environment.
    Monitor: Service Mesh enables observability of your distributed microservices system. Service Mesh often integrates out-of-the-box with monitoring and tracing tools (such as Prometheus and Jaeger in the case of Kubernetes) to allow you to discover and visualize dependencies between services, traffic flow, API latencies, and tracing.
 
Service Mesh Options for Kubernetes:
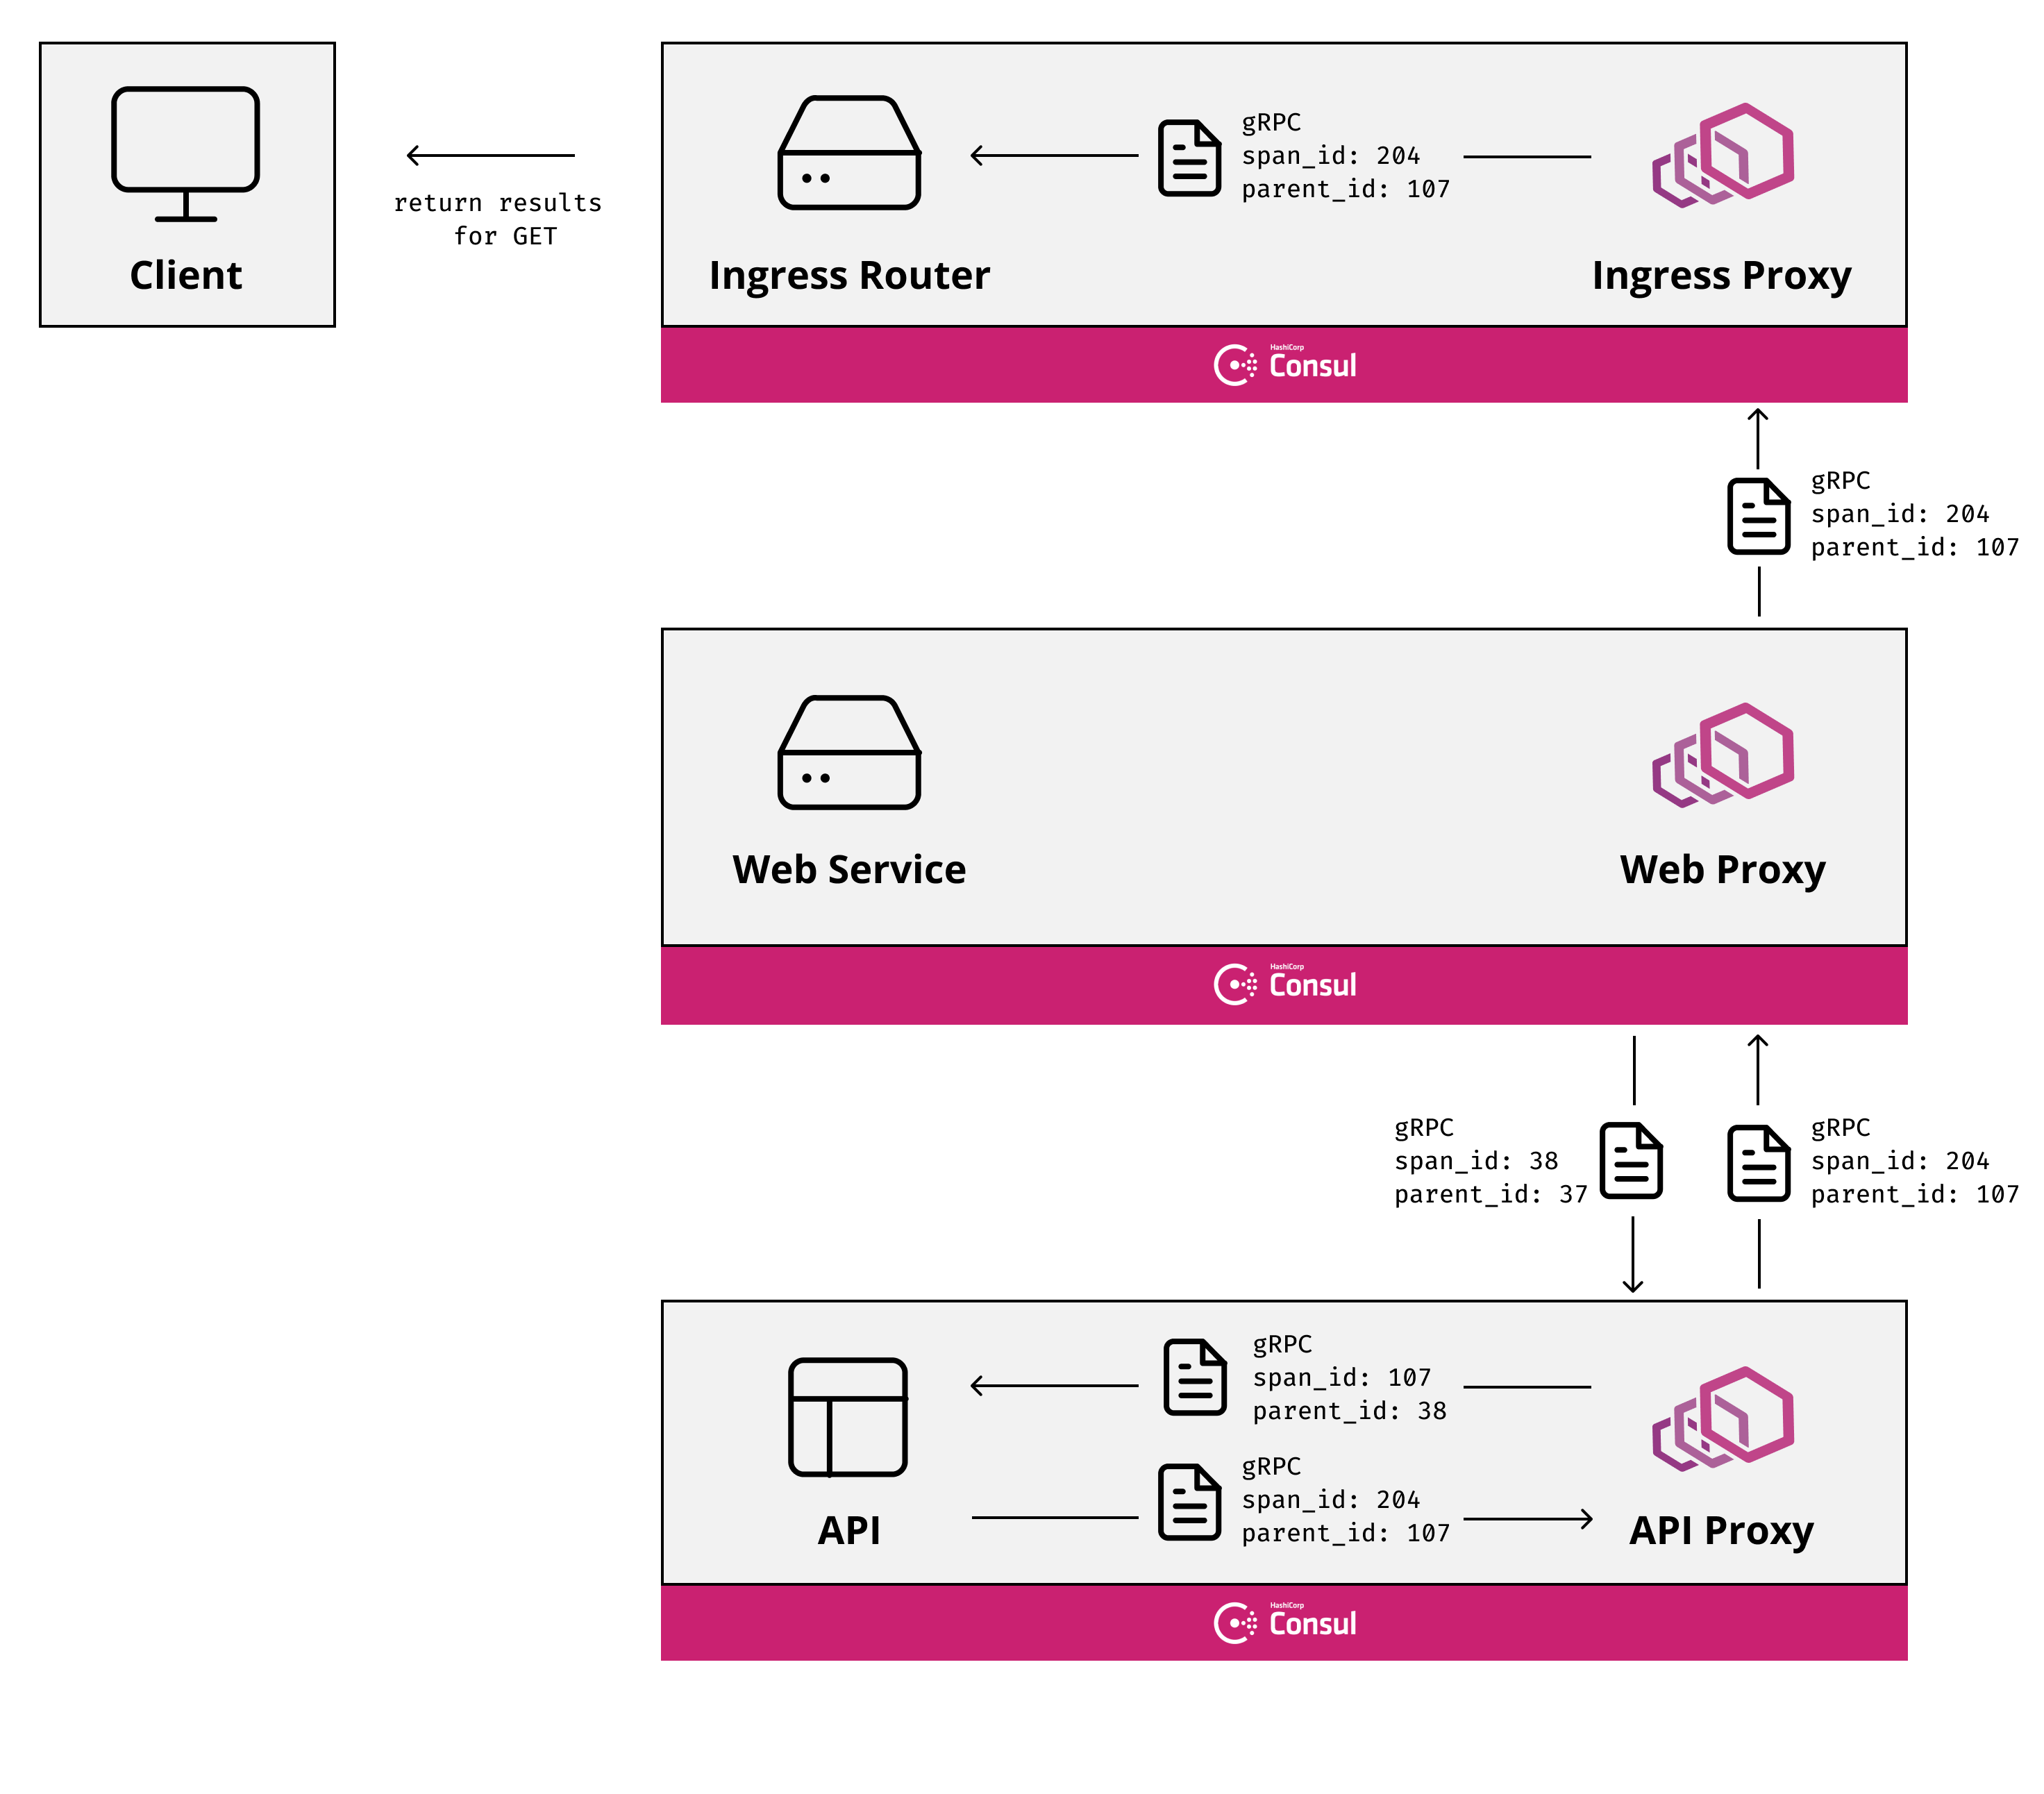
Consul
Consul is part of HashiCorp’s suite of infrastructure management products
it started as a way to manage services running on Nomad and has grown to support multiple other data center and container management platforms including Kubernetes.
Consul Connect uses an agent installed on every node as a DaemonSet which communicates with the Envoy sidecar proxies that handles routing & forwarding of traffic.
Istio
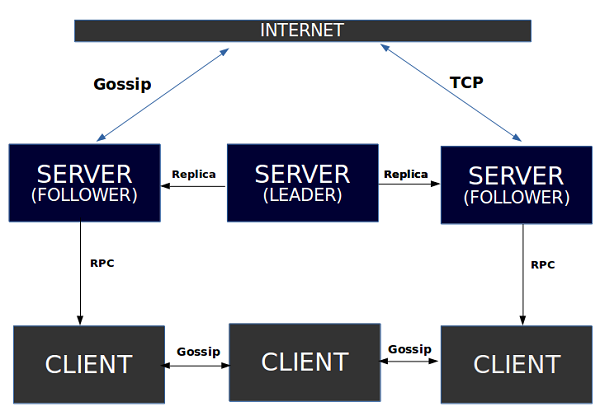
Istio has separated its data and control planes by using a sidecar loaded proxy which caches information so that it does not need to go back to the control plane for every call
The control planes are pods that also run in the Kubernetes cluster, allowing for better resilience in the event that there is a failure of a single pod in any part of the service mesh
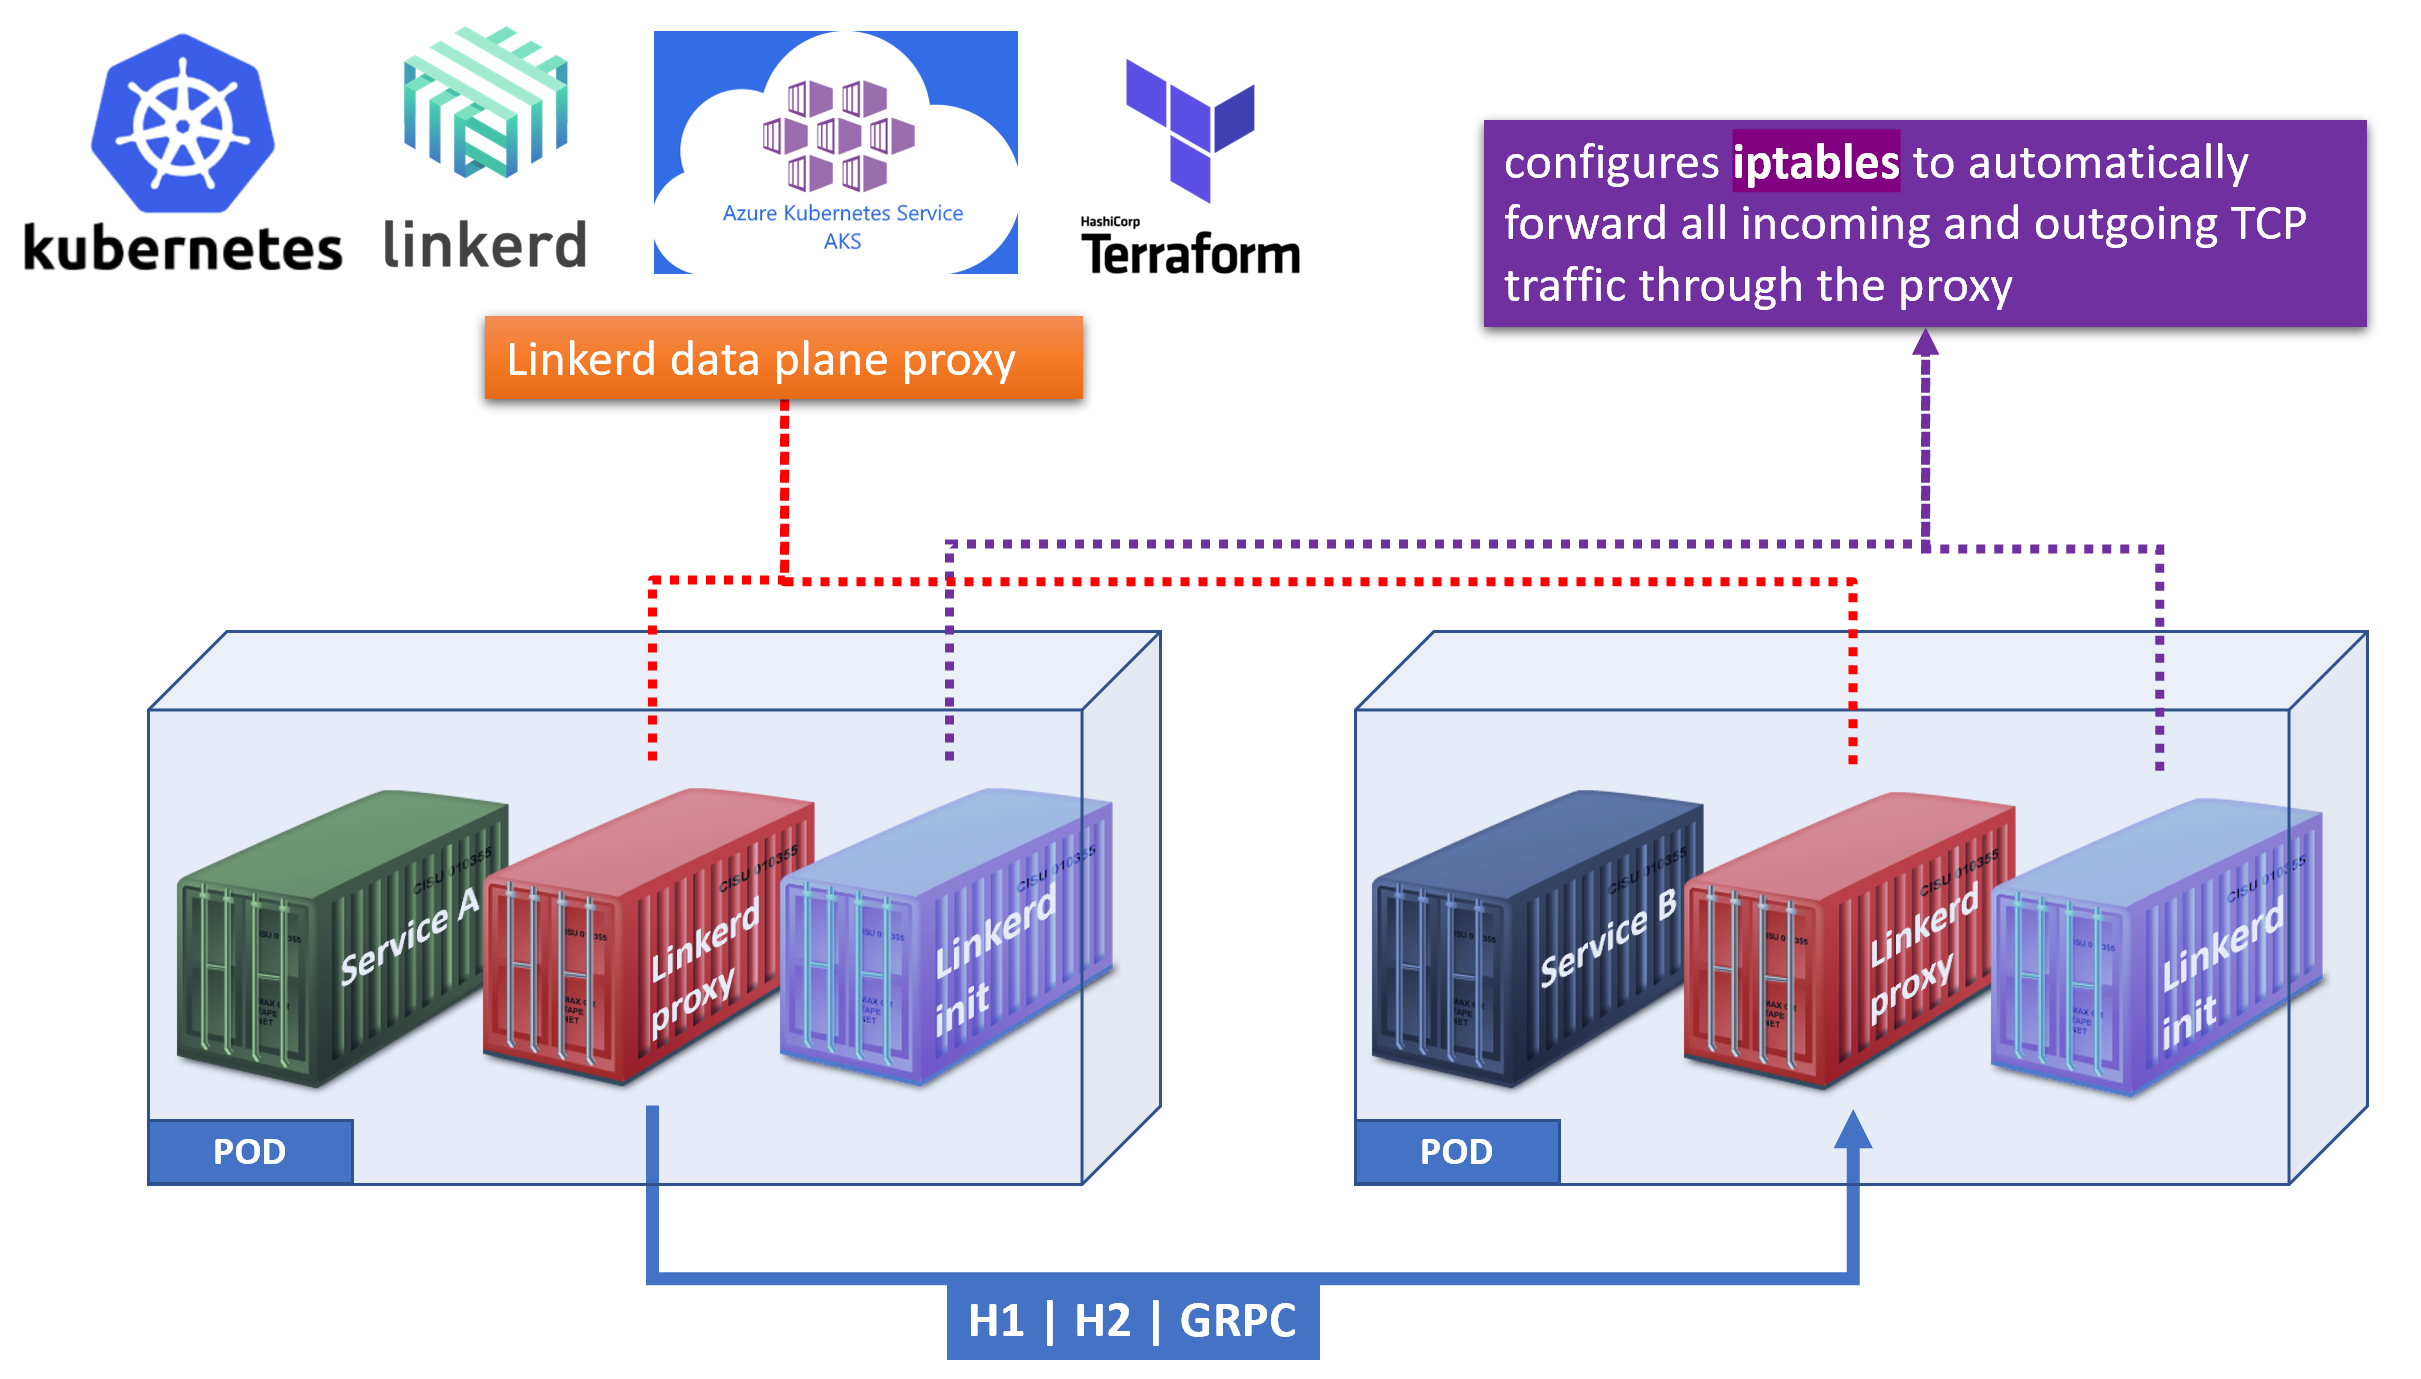
Linkerd
its architecture mirrors Istio’s closely, with an initial focus on simplicity instead of flexibility.
This fact, along with it being a Kubernetes-only solution
While Linkerd v1.x is still supported, and it supports more container platforms than Kubernetes; new features (like blue/green deployments) are focused on v2. primarily.

Istio has the most features and flexibility of any of these three service meshes by far, but remember that flexibility means complexity, so your team needs to be ready for that.
For a minimalistic approach supporting just Kubernetes, Linkerd may be the best choice.
If you want to support a heterogeneous environment that includes both Kubernetes and VMs and do not need the complexity of Istio, then Consul would probably be your best bet.

Migrating between service mesh solutions
Note that service mesh is not as an intrusive transformation as the one from monolithic applications to microservices, or from VMs to Kubernetes-based applications.
Since most meshes use the sidecar model, most services don’t know that they run as a mesh.
Service Mesh is useful for any type of microservices architecture since it helps you control traffic, security, permissions, and observability.

you can start standardizing on Service Mesh in your system design to lay the building blocks and the critical components for large-scale operations

Improving observability into distributed services: For example, If one service in the architecture becomes a bottleneck, the common way to handle it is through re-tries, but that can worsen the bottleneck due to timeouts. With service mesh, you can easily break the circuit to failed services to disable non-functioning replicas and keep the API responsive.

Blue/green deployments: Service mesh allows you to implement Blue/Green deployments to safely rollout new upgrades of the applications without risking service interruption.
First, you expose only a small subset of users to the new version, validate it, then proceed to release it to all instances in Production.

Chaos monkey/ testing in production scenarios: with the ability to inject delays, faults to improve the robustness of deployments

‘Bridge’ / enabler for modernizing legacy applications:If you’re in the throes of modernizing your existing applications to Kubernetes-based microservices, you can use service mesh as a ‘bridge’ while you’re de-composing your apps.
you can use service mesh as a ‘bridge’ while you’re de-composing your apps. You can register your existing applications as ‘services’ in the Istio service catalog and then start migrating them gradually to Kubernetes without changing the mode of communication between services – like a DNS router. This use case is similar to using Service Directory.

API Gateway:If you’re bought into the vision of service mesh and want to start the rollout,you can already have your Operations team start learning the ropes of using service mesh by deploying it simply to measure your API usage.

Service mesh becomes the dashboard for microservices architecture. It’s the place for troubleshooting issues, enforcing traffic policies, rate limits, and testing new code. It’s your hub for monitoring, tracing and controlling the interactions between all services – how they are connected, perform and secured.
https://platform9.com/blog/kubernetes-service-mesh-a-comparison-of-istio-linkerd-and-consul/


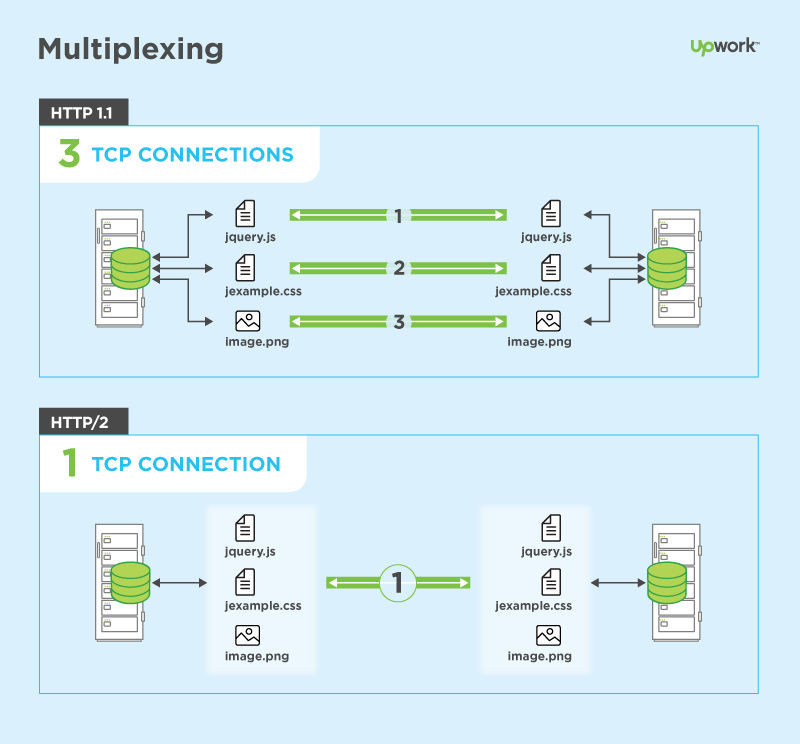
  • HTTP/2 (originally named HTTP/2.0) is a major revision of the HTTP network protocol used by the World Wide Web.


Differences from HTTP 1.1
The proposed changes do not require any changes to how existing web applications work, but new applications can take advantage of new features for increased speed
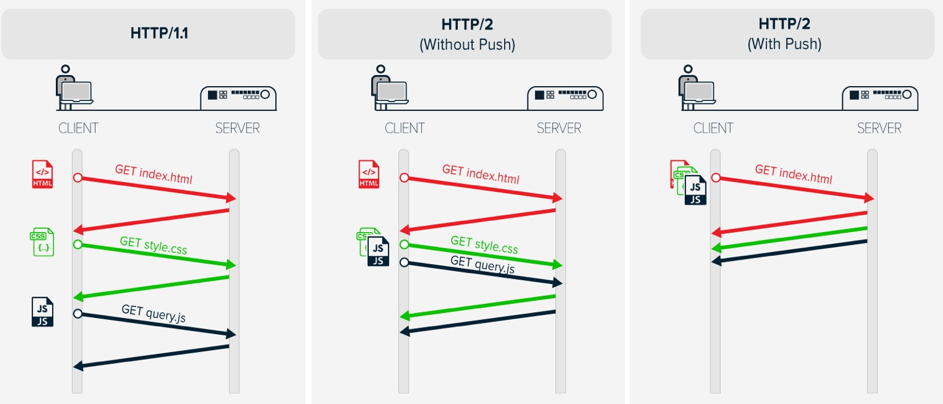
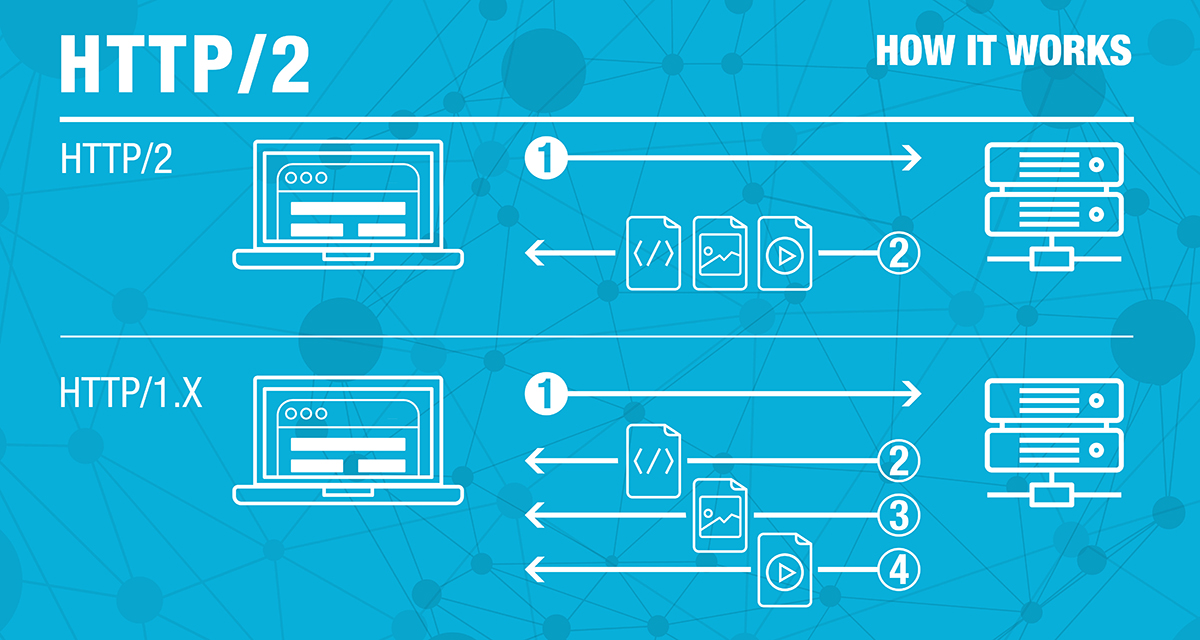
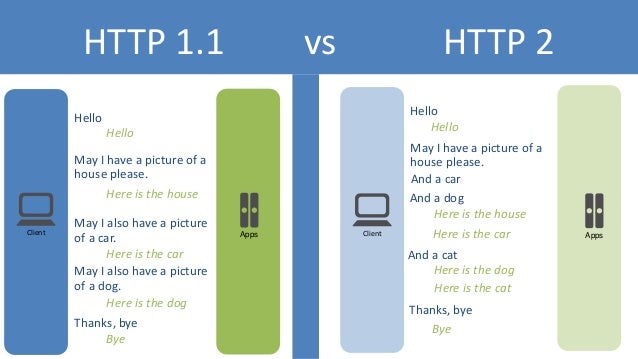
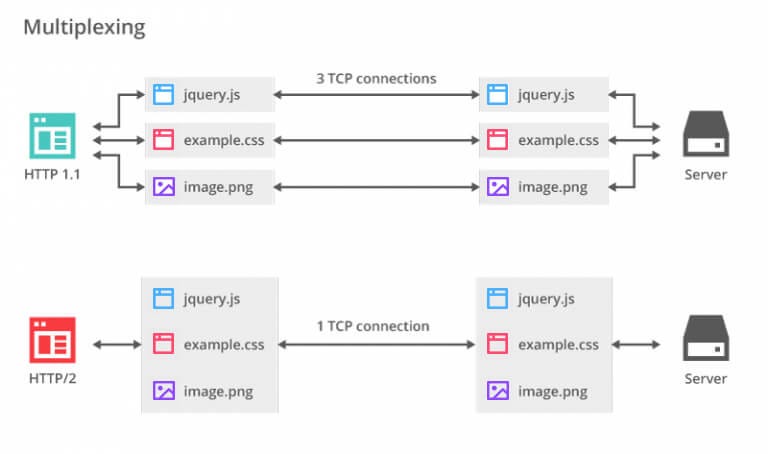
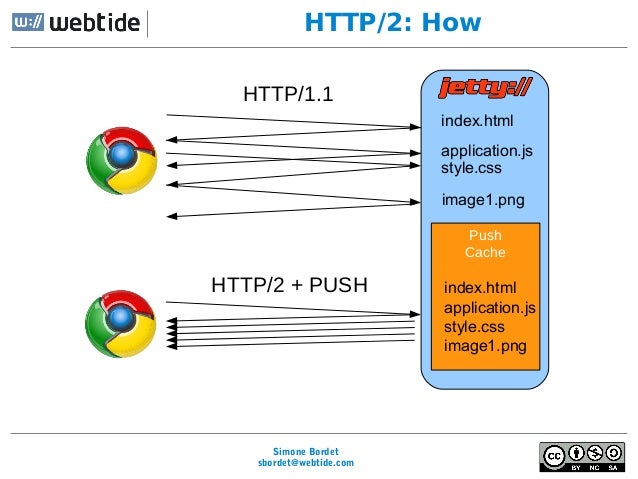
What is new is how the data is framed and transported between the client and the server.Websites that are efficient minimize the number of requests required to render an entire page by minifying (reducing the amount of code and packing smaller pieces of code into bundles, without reducing its ability to function) resources such as images and scripts. However, minification is not necessarily convenient nor efficient and may still require separate HTTP connections to get the page and the minified resources. HTTP/2 allows the server to "push" content, that is, to respond with data for more queries than the client requested. This allows the server to supply data it knows a web browser will need to render a web page, without waiting for the browser to examine the first response, and without the overhead of an additional request cycle.

https://en.wikipedia.org/wiki/HTTP/2


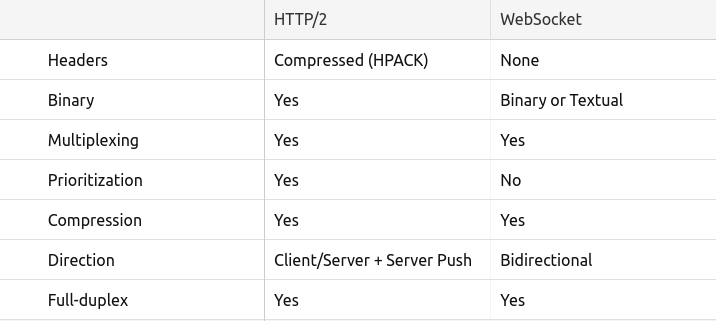
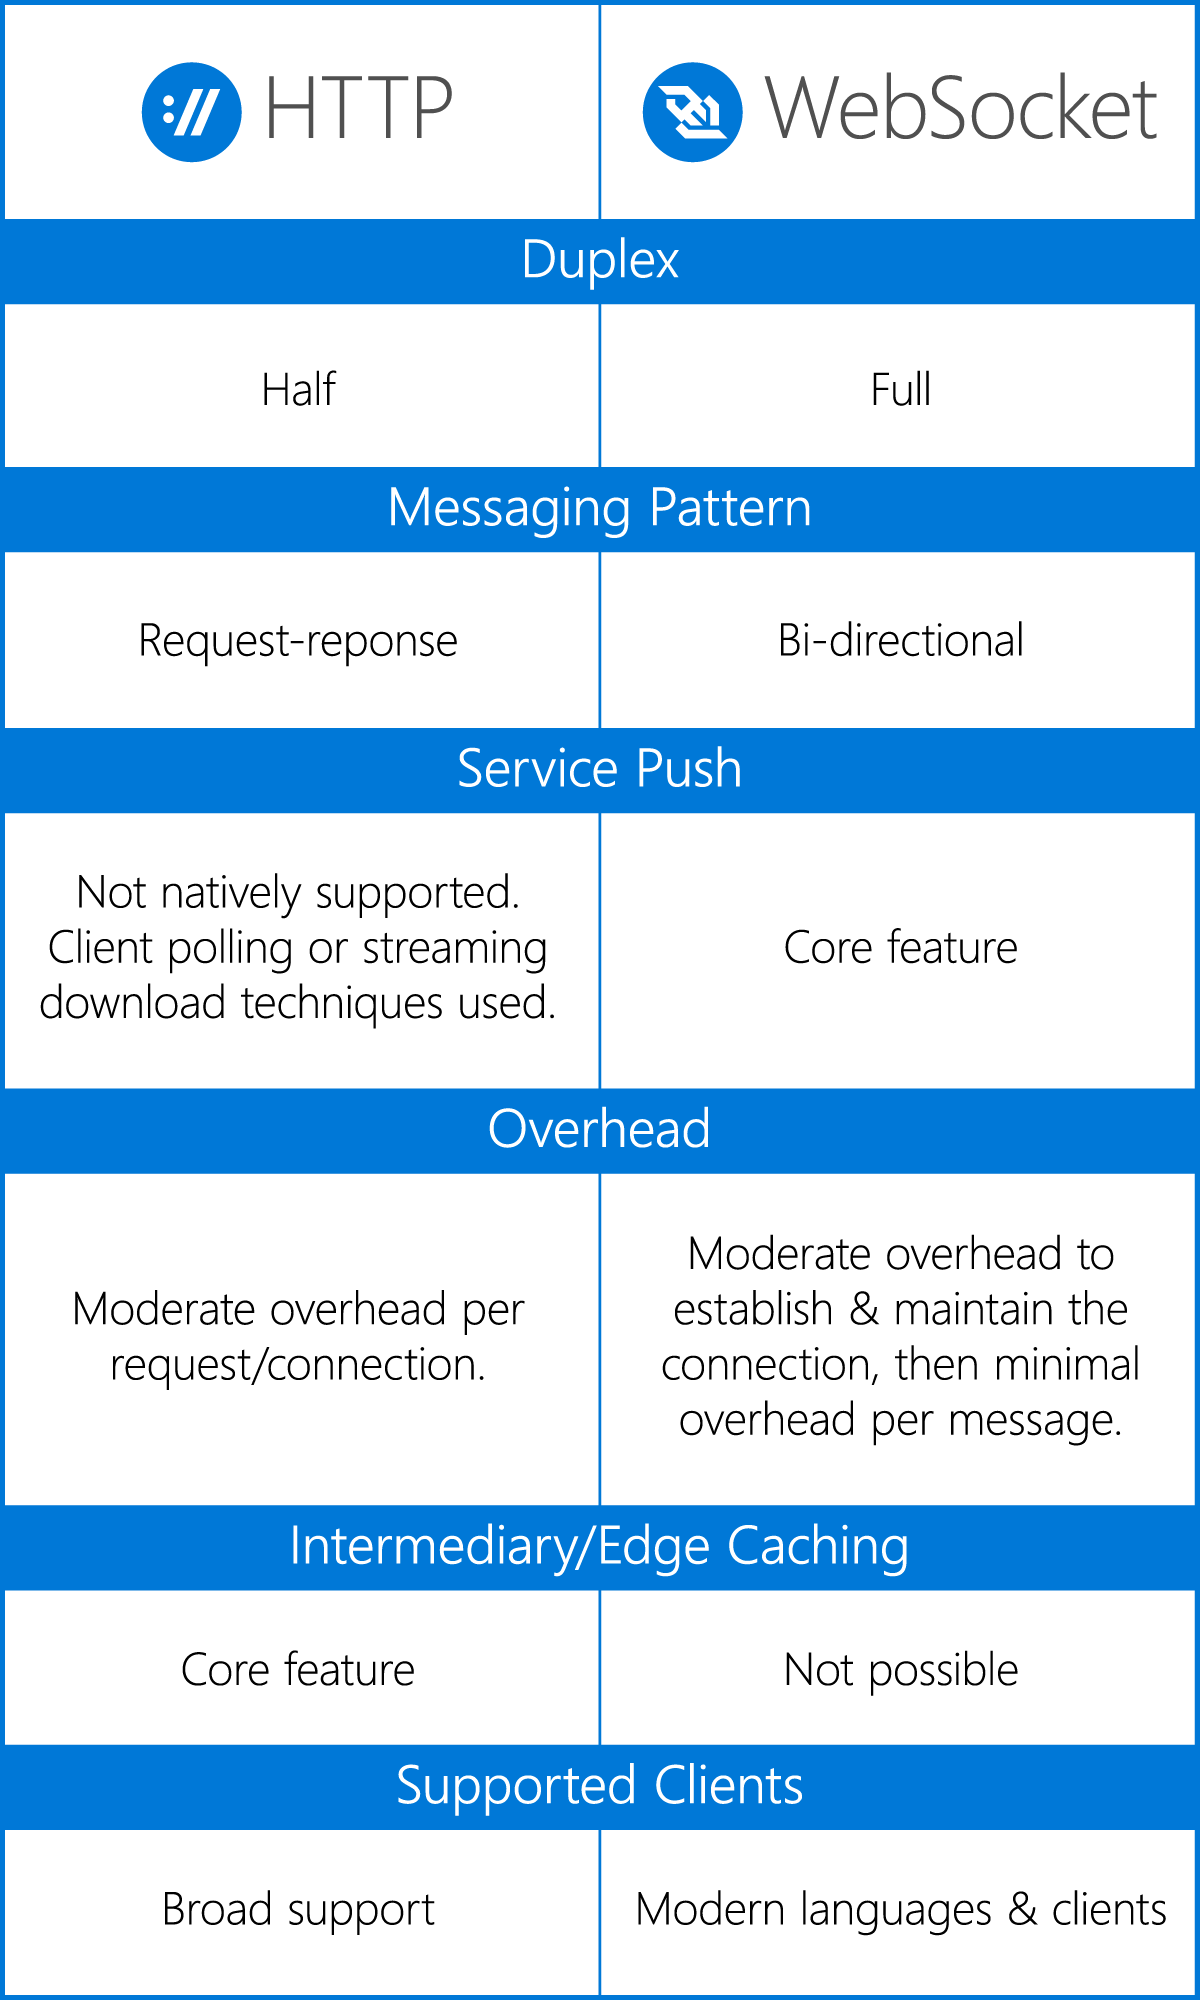
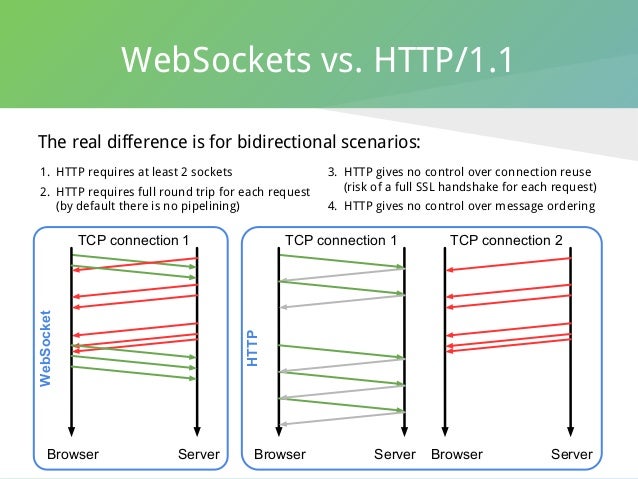
  • WebSocket is a computer communications protocol, providing full-duplex communication channels over a single TCP connection. The WebSocket protocol was standardized by the IETF as RFC 6455 in 2011, and the WebSocket API in Web IDL is being standardized by the W3C.WebSocket is distinct from HTTP. Both protocols are located at layer 7 in the OSI model and depend on TCP at layer 4

Although they are different, RFC 6455 states that WebSocket "is designed to work over HTTP ports 80 and 443 as well as to support HTTP proxies and intermediaries," thus making it compatible with the HTTP protocol. To achieve compatibility, the WebSocket handshake uses the HTTP Upgrade header[1] to change from the HTTP protocol to the WebSocket protocol.
The WebSocket protocol enables interaction between a web browser (or other client application) and a web server with lower overhead than half-duplex alternatives such as HTTP polling, facilitating real-time data transfer from and to the server.
https://en.wikipedia.org/wiki/WebSocket


  • Why gRPC?


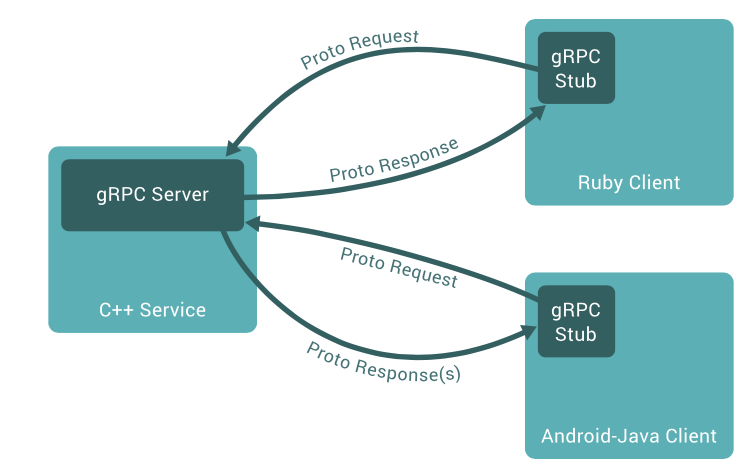
gRPC is a modern open source high performance RPC framework that can run in any environment. It can efficiently connect services in and across data centers with pluggable support for load balancing, tracing, health checking and authentication.
Bi-directional streaming and integrated auth
Bi-directional streaming and fully integrated pluggable authentication with HTTP/2-based transport
https://grpc.io/

Wednesday, May 27, 2020

Multi-Processing


  • OpenACC is a directive-based programming model designed to provide a simple yet powerful approach to accelerators without significant programming effort. With OpenACC, a single version of the source code will deliver performance portability across the platforms.


The NVIDIA HPC SDK™ with OpenACC offers scientists and researchers a quick path to accelerated computing with less programming effort. By inserting compiler “hints” or directives into your C11, C++17 or Fortran 2003 code, with the NVIDIA OpenACC compiler you can offload and run your code on the GPU and CPU.

https://developer.nvidia.com/openacc


  • OpenACC is a user-driven directive-based performance-portable parallel programming model. It is designed for scientists and engineers interested in porting their codes to a wide-variety of heterogeneous HPC hardware platforms and architectures with significantly less programming effort than required with a low-level model. The OpenACC specification supports C, C++, Fortran programming languages and multiple hardware architectures including X86 & POWER CPUs, and NVIDIA GPUs.

https://www.openacc.org/


  • OpenMP (Open Multi-Processing) is an application programming interface (API) that supports multi-platform shared memory multiprocessing programming in C, C++, and Fortran .OpenMP is designed for multi-processor/core, shared memory machines. The underlying architecture can be shared memory UMA or NUMA. 

http://hpc.mediawiki.hull.ac.uk/Programming/OpenMP


  • Sequential Program

When you run sequential program
Instructions executed on 1 core
Other cores are idle
Waste of available resources. We want all cores to be used to execute program.
What is OpenMP?
Defacto standard API for writing shared memory parallel applications in C, C++, and Fortran
OpenMP API consists of:
Compiler Directives
Runtime subroutines/functions
Environment variables
https://people.math.umass.edu/~johnston/PHI_WG_2014/OpenMPSlides_tamu_sc.pdf


  • Memory modelsParallel computing is about data processing.In practice, memory models determine how we write parallel programs

Two types:Shared memory modelDistributed memory mode
Shared MemoryAll CPUs have access to the (shared) memory
Distributed MemoryEach CPU has its own (local) memory, invisible to other CPUs


  • Hybrid Model

Shared-memory style within a node
Distributed-memory style across nodes
https://idre.ucla.edu/sites/default/files/intro-openmp-2013-02-11.pdf


  • Advantages of OpenMP

Simple programming model –Data decomposition and communication handled by compiler directives •Single source code for serial and parallel codes •No major overwrite of the serial code  •Portable implementation •Progressiveparallelization –Start from most critical or time consuming part of the code
OpenMP vs. MPI
OpenMP Basic Syntax
Loop Parallelism
Threads share the work in loop parallelism. •For example, using 4 threads under the default “static” scheduling, in Fortran: –thread 1 has i=1-250 –thread 2 has i=251-500, etc.
Loop Parallelism:  ordered and collapse
https://www.nersc.gov/assets/Uploads/XE62011OpenMP.pdf
  • HPCaaS

Designed for speed and simplicity, HPCaaS from Rescale on IBM Cloud™ enables you to execute your HPC jobs along with the associated data in a few easy clicks. You configure the workflow and job execution environment (for example, compute cores, memory and GPU options) and execute and monitor the work directly from the easy-to-use portal.
https://www.ibm.com/cloud/hpcaas-from-rescale

Friday, May 8, 2020

Dynamic Programming


  • Dynamic programming is both a mathematical optimization method and a computer programming method.In both contexts it refers to simplifying a complicated problem by breaking it down into simpler sub-problems in a recursive manner. While some decision problems cannot be taken apart this way, decisions that span several points in time do often break apart recursively. Likewise, in computer science, if a problem can be solved optimally by breaking it into sub-problems and then recursively finding the optimal solutions to the sub-problems, then it is said to have optimal substructure.
If sub-problems can be nested recursively inside larger problems, so that dynamic programming methods are applicable, then there is a relation between the value of the larger problem and the values of the sub-problems.In the optimization literature this relationship is called the Bellman equation.

Mathematical optimization

In terms of mathematical optimization, dynamic programming usually refers to simplifying a decision by breaking it down into a sequence of decision steps over time.

Computer programming

There are two key attributes that a problem must have in order for dynamic programming to be applicable: optimal substructure and overlapping sub-problems.
If a problem can be solved by combining optimal solutions to non-overlapping sub-problems, the strategy is called "divide and conquer" instead.This is why merge sort and quick sort are not classified as dynamic programming problems.
Optimal substructure means that the solution to a given optimization problem can be obtained by the combination of optimal solutions to its sub-problems. Such optimal substructures are usually described by means of recursion.
Overlapping sub-problems means that the space of sub-problems must be small, that is, any recursive algorithm solving the problem should solve the same sub-problems over and over, rather than generating new sub-problems. For example, consider the recursive formulation for generating the Fibonacci series.Even though the total number of sub-problems is actually small (only 43 of them), we end up solving the same problems over and over if we adopt a naive recursive solution such as this. Dynamic programming takes account of this fact and solves each sub-problem only once.

This can be achieved in either of two ways:
Top-down approach: This is the direct fall-out of the recursive formulation of any problem. If the solution to any problem can be formulated recursively using the solution to its sub-problems, and if its sub-problems are overlapping, then one can easily memoize or store the solutions to the sub-problems in a table. Whenever we attempt to solve a new sub-problem, we first check the table to see if it is already solved. If a solution has been recorded, we can use it directly, otherwise we solve the sub-problem and add its solution to the table.


Bottom-up approach: Once we formulate the solution to a problem recursively as in terms of its sub-problems, we can try reformulating the problem in a bottom-up fashion: try solving the sub-problems first and use their solutions to build-on and arrive at solutions to bigger sub-problems. This is also usually done in a tabular form by iteratively generating solutions to bigger and bigger sub-problems by using the solutions to small sub-problems. 


https://en.wikipedia.org/wiki/Dynamic_programming


https://en.wikipedia.org/wiki/Memoization

  • That's what Dynamic Programming is about. To always remember answers to the sub-problems you've already solved.
https://www.hackerearth.com/practice/algorithms/dynamic-programming/introduction-to-dynamic-programming-1/tutorial/

  • Dynamic Programming is mainly an optimization over plain recursion. Wherever we see a recursive solution that has repeated calls for same inputs, we can optimize it using Dynamic Programming. The idea is to simply store the results of subproblems, so that we do not have to re-compute them when needed later. This simple optimization reduces time complexities from exponential to polynomial. For example, if we write simple recursive solution for Fibonacci Numbers, we get exponential time complexity and if we optimize it by storing solutions of subproblems, time complexity reduces to linear.
https://www.geeksforgeeks.org/dynamic-programming/

  • Dynamic programming approach is similar to divide and conquer in breaking down the problem into smaller and yet smaller possible sub-problems. But unlike, divide and conquer, these sub-problems are not solved independently. Rather, results of these smaller sub-problems are remembered and used for similar or overlapping sub-problems.
Dynamic programming is used where we have problems, which can be divided into similar sub-problems, so that their results can be re-used. 
  • The problem should be able to be divided into smaller overlapping sub-problem.
  • An optimum solution can be achieved by using an optimum solution of smaller sub-problems.
  • Dynamic algorithms use Memoization.
In contrast to greedy algorithms, where local optimization is addressed, dynamic algorithms are motivated for an overall optimization of the problem.
In contrast to divide and conquer algorithms, where solutions are combined to achieve an overall solution, dynamic algorithms use the output of a smaller sub-problem and then try to optimize a bigger sub-problem. Dynamic algorithms use Memoization to remember the output of already solved sub-problems.

The following computer problems can be solved using dynamic programming approach −
  • Fibonacci number series
  • Knapsack problem
  • Tower of Hanoi
  • All pair shortest path by Floyd-Warshall
  • Shortest path by Dijkstra
  • Project scheduling
https://www.tutorialspoint.com/data_structures_algorithms/dynamic_programming.htm

There are 3 main parts to divide and conquer:
  1. Divide the problem into smaller sub-problems of the same type.
  2. Conquer - solve the sub-problems recursively.
  3. Combine - Combine all the sub-problems to create a solution to the original problem.
https://skerritt.blog/dynamic-programming/

Dynamic Programming Defined

Dynamic programming amounts to breaking down an optimization problem into simpler sub-problems, and storing the solution to each sub-problem so that each sub-problem is only solved once.
https://www.freecodecamp.org/news/demystifying-dynamic-programming-3efafb8d4296/

Saturday, May 2, 2020

lustre


  • The Lustre file system is a parallel file system used in a wide range of HPC environments

https://it.nec.com/it_IT/global/solutions/hpc/storage/lxfs.html?


  • How the Lustre Developer Community is Advancing ZFS as a Lustre Back-end File System

    Increasing support on Lustre for a 16 MB block size—already supported by ZFS—which will increase the size of data blocks written to each disk. A larger block size will reduce disk seeks and boost read performance. This, in turn, will require supporting a dynamic OSD-ZFS block size to prevent an increase in read/modify/write operations.
    Implementing a dRAID mechanism instead of RAIDZ to boost performance when a drive fails. With RAIDZ, throughput of a disk group is limited by the spare disk’s bandwidth. dRAID will use a mechanism that distributes data to spare blocks among the remaining disks. Throughput is expected to improve even when the group is degraded because of a failed drive.
    Creating a separate Metadata allocation class to allow a dedicated high throughput VDEV for storing Metadata. Since ZFS Metadata is smaller, but fundamental, reading it faster will result in enhanced IO performance. The VDEV should be an SSD or NVRAM, and it can be mirrored for redundancy.
    https://www.codeproject.com/Articles/1191923/How-the-Lustre-Developer-Community-is-Advancing-ZF


  • ZFS OSD Hardware Considerations

The double parity implementation in OpenZFS (RAID-Z2) recommended for object storage targets (OST) uses an algorithm similar to RAID-6, but is implemented in software and not in a RAID card or a separate storage controller.
OpenZFS uses a copy-on-write transactional object model that makes extensive use of 256-bit checksums for all data blocks, using hash algorithms like Fletcher-4 and SHA-256. This makes the choice of CPU an important consideration when designing servers that use ZFS storage.
Metadata server workloads are IOps-centric, characterized by small transactions that run at very high rates and benefit from frequency-optimized CPUs.
Object storage server workloads are throughput-centric, often with long-running, streaming transactions. Because the workloads are oriented more toward streaming IO, object storage servers are less sensitive to CPU frequency than metadata servers,
http://wiki.lustre.org/ZFS_OSD_Hardware_Considerations

Friday, May 1, 2020

iRODS


  • The integrated Rule-Oriented Data System (iRODS) is open source data management software.It virtualizes data storage resources, so users can take control of their data, regardless of where and on what device the data is stored.

Core Competencies

    iRODS implements data virtualization, allowing access to distributed storage assets under a unified namespace, and freeing organizations from getting locked in to single-vendor storage solutions.
    iRODS enables data discovery using a metadata catalog that describes every file, every directory, and every storage resource in the iRODS Zone.
    iRODS automates data workflows, with a rule engine that permits any action to be initiated by any trigger on any server or client in the Zone.
    iRODS enables secure collaboration, so users only need to log in to their home Zone to access data hosted on a remote Zone.

https://github.com/irods/irods


  • Installation


iRODS is provided in binary form in a collection of interdependent packages. There are two types of iRODS server, iCAT and Resource:

    An iCAT server manages a Zone, handles the database connection to the iCAT metadata catalog (which could be either local or remote), and can provide Storage Resources. An iRODS Zone will have exactly one iCAT server.
    A Resource server connects to an existing Zone and can provide additional storage resource(s). An iRODS Zone can have zero or more Resource servers.

An iCAT server is just a Resource server that also provides the central point of coordination for the Zone and manages the metadata.
A single computer cannot have both an iCAT server and a Resource server installed.
The simplest iRODS installation consists of one iCAT server and zero Resource servers.
https://docs.irods.org/4.1.9/manual/installation/


  • iRODS is open source data grid middleware for... 

•Data Discovery :metadata
•Workflow Automation :policies : any condition; any action
•Secure Collaboration :sharing without losing control
•Data Virtualization :file system flexibility

Using iRODS   for...
  Data Virtualiza1on with Workflow Automation
  Seamless data replication,
  automatic checksumming,
  policy-based data resource selection

Using iRODS for...
  Secure Collabora1on
  Selectively sharing data between workgroups;
  isolation for maintenance operations;
  options for defining policy on a per-group basis
  
Using iRODS for...   
Data Discovery and Workflow Automa1on
  Metadata automatically generated from original file system,
  used to enforce policy and verify integrity
Policy 1 – Validate,checksum,replicate, compress
Policy 2 – Users cannot delete files
Policy 3 – Purge files by expiration  

Using iRODS for...
Data Virtualization with Workflow Automation
  Automatically staging data for HPC and interpretation;
  using hardware from multiple vendors;

iRODS
•Metadata! 
•Vendor neutrality
–Not subject to storage vendor lock-in 
–Mitigates risk of vendor termination
•Open source 
–Mitigate risk of developer termination 
•Flexibility 
–Policy enforcement: any trigger, any action 
–Storage virtualization: layers-deep replication; local <> cloud
–User permissions 
•Sharing between workgroups

http://docplayer.net/7491516-Managing-next-generation-sequencing-data-with-irods.html


openstack


  • Monitoring
     Centralized logging: Allows you gather logs from all components in the OpenStack environment in one central location. You can identify problems across all nodes and services, and optionally, export the log data to Red Hat for assistance in diagnosing problems.
 
    Availability monitoring: Allows you to monitor all components in the OpenStack environment and determine if any components are currently experiencing outages or are otherwise not functional. You can also configure the system to alert you when problems are identified. 
 
Monitoring tools use a client-server model with the client deployed onto the Red Hat OpenStack Platform overcloud nodes. 
The Fluentd service provides client-side centralized logging (CL) and 
the Sensu client service provides client-side availability monitoring (AM). 
2.1. Centralized Logging

Centralized logging allows you to have one central place to view logs across your entire OpenStack environment. These logs come from the operating system, such as syslog and audit log files, infrastructure components such as RabbitMQ and MariaDB, and OpenStack services such as Identity, Compute, and others. 

 The centralized logging toolchain consists of a number of components, including:

    Log Collection Agent (Fluentd)
    Log Relay/Transformer (Fluentd)
    Data Store (Elasticsearch)
    API/Presentation Layer (Kibana) 

2.2. Availability Monitoring

 Availability monitoring allows you to have one central place to monitor the high-level functionality of all components across your entire OpenStack environment.

The availability monitoring toolchain consists of a number of components, including:

    Monitoring Agent (Sensu client)
    Monitoring Relay/Proxy (RabbitMQ)
    Monitoring Controller/Server (Sensu server)
    API/Presentation Layer (Uchiwa) 

 
 https://access.redhat.com/documentation/en-us/red_hat_openstack_platform/15/html-single/monitoring_tools_configuration_guide/index


  • Monitoring Tools
Nagios

ensure that the nova-compute process is running on the compute nodes, create an alert on your Nagios server
Nagios alerts you with a WARNING when any disk on the compute node is 80 percent full and CRITICAL when 90 percent is full.

StackTach
StackTach is a tool that collects and reports the notifications sent by nova

Logstash

Logstash is a high performance indexing and search engine for logs. Logs from Jenkins test runs are sent to logstash where they are indexed and stored. Logstash facilitates reviewing logs from multiple sources in a single test run, searching for errors or particular events within a test run, and searching for log event trends across test runs. 
There are four major layers in Logstash setup which are:

    Log Pusher
    Log Indexer
    ElasticSearch
    Kibana
https://wiki.openstack.org/wiki/OpsGuide-Monitoring#Monitoring_Tools
  • Using Prometheus Operator to monitor OpenStack

Monitoring at scale issues - Ceilometer

Current OpenStack telemetry & metrics/events mechanisms most
suited for chargeback applications

A typical monitoring interval for Ceilometer/Panko/Aodh/Gnocchi
combination is 10 minutes

Monitoring at scale issues - collectd

Red Hat OpenStack Platform included collectd for performance monitoring using
collectd plug-ins

Similar issues as Ceilometer with monitoring at scale

Problem:
Current Openstack telemetry and metrics do not scale for large
enterprises & to monitor the health of NFVi for telcos

Time series database / management cluster level
 Prometheus Operator

CEILOMETER & GNOCCHI will continue to be used for chargeback and
tenant metering

Prometheus
Open Source Monitoring
● Only Metrics, Not Logging
● Pull based approach
● Multidimensional data model
● Time series database
● Evaluates rules for alerting and triggers alerts
● Flexible, Robust query language - PromQL

What is Operator?

Automated Software Management
purpose-built to run a Kubernetes application,
with operational knowledge baked in
Manage Installation & lifecycle of Kubernetes applications
Extends native kubernetes configuration hooks
Custom Resource definitions

Prometheus Operator
Prometheus operational knowledge in software
● Easy deployment & maintenance of prometheus
● Abstracts out complex configuration paradigms
● Kubernetes native configuration
● Preserves the configurability

Other Components

ElasticSearch
○ System events and logs are stored in ElasticSearch as part of an ELK stack running
in the same cluster as the Prometheus Operator
○ Events are stored in ElasticSearch and can be forwarded to Prometheus Alert
Manager
○ Alerts that are generated from Prometheus Alert rule processing can be sent from
Prometheus Alert Manager to the QDR bus

Smart Gateway -- AMQP / Prometheus bridge
○ Receives metrics from AMQP bus, converts collectd format to Prometheus, coallates
data from plugins and nodes, and presents the data to Prometheus through an HTTP
server
○ Relay alarms from Prometheus to AMQP bus

Grafana
○ Prometheus data source to visualize data

Prometheus Management Cluster

Runs Prometheus Operator on top of Kubernetes
● A collection of Kubernetes manifests and Prometheus rules
combined to provide single-command deployments
● Introduces resources such as Prometheus, Alert Manager,
ServiceMonitor
● Elasticsearch for storing Events
● Grafana dashboards for visualization
● Self-monitoring cluster

https://object-storage-ca-ymq-1.vexxhost.net/swift/v1/6e4619c416ff4bd19e1c087f27a43eea/www-assets-prod/presentation-media/OpenStack-Summit-2018-Prometheus-Operator-to-monitor-OpenStack.pdf


  • TripleO is a project aimed at installing, upgrading and operating OpenStack clouds using OpenStack’s own cloud facilities as the foundation - building on Nova, Ironic, Neutron and Heat to automate cloud management at datacenter scale
https://docs.openstack.org/tripleo-docs/latest/

  • TripleO (OpenStack On OpenStack) is a program aimed at installing, upgrading and operating OpenStack clouds using OpenStack's own cloud facilities as the foundations - building on nova, neutron and heat to automate fleet management at datacentre scale.

https://wiki.openstack.org/wiki/TripleO


  • TripleO is an OpenStack Deployment & Management tool.

With TripleO, you start by creating an undercloud (an actual operator facing deployment cloud) that will contain the necessary OpenStack components to deploy and manage an overcloud (an actual tenant facing workload cloud). The overcloud is the deployed solution and can represent a cloud for any purpose (e.g. production, staging, test, etc). The operator can choose any of available Overcloud Roles (controller, compute, etc.) they want to deploy to the environment.
https://docs.openstack.org/tripleo-docs/latest/install/introduction/introduction.html


  • TripleO

TripleO is the friendly name for “OpenStack on OpenStack”. It is an official OpenStack project with the goal of allowing you to deploy and manage a production cloud onto bare metal hardware using a subset of existing OpenStack components.
 
 With TripleO, you start by creating an “undercloud” (a deployment cloud) that will contain the necessary OpenStack components to deploy and manage an “overcloud” (a workload cloud). The overcloud is the deployed solution and can represent a cloud for any purpose (e.g. production, staging, test, etc).
 
 TripleO leverages several existing core components of OpenStack including Nova, Ironic, Neutron, Heat, Glance and Ceilometer to deploy OpenStack on baremetal hardware
 Nova and Ironic are used in the undercloud to manage baremetal instances that comprise the infrastructure for the overcloud. 
 Neutron is utilized to provide a networking environment in which to deploy the overcloud, machine images are stored in Glance, and Ceilometer collects metrics about your overcloud.
https://docs.openstack.org/tripleo-docs/latest/install/introduction/architecture.html


  • What is Mogan?
Mogan is an OpenStack project which offers bare metals as first class resources to users, supporting variety of bare metal provisioning drivers including Ironic.
Why Mogan?
OpenStack Nova supports provisioning of virtual machines (VMs), bare metal and containers. True, BUT, Nova design started off as a virtual machine scheduler, with features specific to this use case. Nova enhancements to unify requesting any compute instance, be it VM, container or Bare Metal, while wonderful, unfortunately is convoluted at best, requiring the user to execute additional steps. Further, it does not yet support the more advanced requirements of bare metal provisioning such as storage and network configuration.

All Ironic nodes are associated with a single host aggregate in Nova, because of the notion that a compute *service* is equal to the compute *node*.
No affinity/anti-affinity support for bare metals in Nova, as it's based on *host*.
No specific APIs for bare metals like RAID configuration, Advanced partitioning at deploy time, Firmware management, etc.
https://wiki.openstack.org/wiki/Mogan


  • Keystone is an OpenStack service that provides API client authentication, service discovery, and distributed multi-tenant authorization by implementing OpenStack’s Identity API.

https://docs.openstack.org/keystone/latest/


  • The OpenStack Object Store project, known as Swift, offers cloud storage software so that you can store and retrieve lots of data with a simple API. It's built for scale and optimized for durability, availability, and concurrency across the entire data set. Swift is ideal for storing unstructured data that can grow without bound

https://wiki.openstack.org/wiki/Swift


What is Cinder?
Cinder is the OpenStack Block Storage service for providing volumes to Nova virtual machines, Ironic bare metal hosts, containers and more. Some of the goals of Cinder are to be/have:
Component based architecture: Quickly add new behaviors
Highly available: Scale to very serious workloads
Fault-Tolerant: Isolated processes avoid cascading failures
Recoverable: Failures should be easy to diagnose, debug, and rectify
Open Standards: Be a reference implementation for a community-driven ap
https://docs.openstack.org/cinder/latest/


Glance image services include discovering, registering, and retrieving virtual machine (VM) images. Glance has a RESTful API that allows querying of VM image metadata as well as retrieval of the actual image.
https://docs.openstack.org/glance/latest/


What is nova?
Nova is the OpenStack project that provides a way to provision compute instances (aka virtual servers). Nova supports creating virtual machines, baremetal servers (through the use of ironic), and has limited support for system containers. Nova runs as a set of daemons on top of existing Linux servers to provide that service.

It requires the following additional OpenStack services for basic function:

Keystone: This provides identity and authentication for all OpenStack services.

Glance: This provides the compute image repository. All compute instances launch from glance images.

Neutron: This is responsible for provisioning the virtual or physical networks that compute instances connect to on boot.

Placement: This is responsible for tracking inventory of resources available in a cloud and assisting in choosing which provider of those resources will be used when creating a virtual machine.
https://docs.openstack.org/nova/latest/


Neutron is an OpenStack project to provide “network connectivity as a service” between interface devices (e.g., vNICs) managed by other OpenStack services (e.g., nova). It implements the OpenStack Networking API.
https://docs.openstack.org/neutron/latest/
  • Neutron ML2

The Modular Layer 2 (ml2) plugin is a framework allowing OpenStack Networking to simultaneously utilize the variety of layer 2 networking technologies found in complex real-world data centers. It currently works with the existing openvswitch, linuxbridge, and hyperv L2 agents, and is intended to replace and deprecate the monolithic plugins associated with those L2 agents
https://wiki.openstack.org/wiki/Neutron/ML2

  • 2.5.1. The reasoning behind ML2

Previously, OpenStack Networking deployments were only able to use the plug-in that had been selected at implementation time. For example, a deployment running the Open vSwitch plug-in was only able to use Open vSwitch exclusively; it wasn’t possible to simultaneously run another plug-in such as linuxbridge. This was found to be a limitation in environments with heterogeneous requirements. 

2.5.2. ML2 network types

Multiple network segment types can be operated concurrently. In addition, these network segments can interconnect using ML2’s support for multi-segmented networks. Ports are automatically bound to the segment with connectivity; it is not necessary to bind them to a specific segment. Depending on the mechanism driver, ML2 supports the following network segment types:

    flat
    GRE
    local
    VLAN
    VXLAN 
https://access.redhat.com/documentation/en-us/red_hat_openstack_platform/12/html/networking_guide/openstack_networking_concepts


  • The placement API service was introduced in the 14.0.0 Newton release within the nova repository and extracted to the placement repository in the 19.0.0 Stein release. This is a REST API stack and data model used to track resource provider inventories and usages, along with different classes of resources. For example, a resource provider can be a compute node, a shared storage pool, or an IP allocation pool. The placement service tracks the inventory and usage of each provider. For example, an instance created on a compute node may be a consumer of resources such as RAM and CPU from a compute node resource provider, disk from an external shared storage pool resource provider and IP addresses from an external IP pool resource provider.


The types of resources consumed are tracked as classes. The service provides a set of standard resource classes (for example DISK_GB, MEMORY_MB, and VCPU) and provides the ability to define custom resource classes as needed.

Each resource provider may also have a set of traits which describe qualitative aspects of the resource provider. Traits describe an aspect of a resource provider that cannot itself be consumed but a workload may wish to specify. For example, available disk may be solid state drives (SSD).
https://docs.openstack.org/placement/latest/

  • Heat is a service to orchestrate composite cloud applications using a declarative template format through an OpenStack-native REST API.

Heat’s purpose and vision
Heat provides a template based orchestration for describing a cloud application by executing appropriate OpenStack API calls to generate running cloud applications.
A Heat template describes the infrastructure for a cloud application in text files which are readable and writable by humans, and can be managed by version control tools.
Templates specify the relationships between resources (e.g. this volume is connected to this server). This enables Heat to call out to the OpenStack APIs to create all of your infrastructure in the correct order to completely launch your application.
The software integrates other components of OpenStack. The templates allow creation of most OpenStack resource types (such as instances, floating ips, volumes, security groups, users, etc), as well as some more advanced functionality such as instance high availability, instance autoscaling, and nested stacks.
Heat primarily manages infrastructure, but the templates integrate well with software configuration management tools such as Puppet and Ansible.


Operators can customise the capabilities of Heat by installing plugins.
https://docs.openstack.org/heat/latest/

  • The Ceilometer project is a data collection service that provides the ability to normalise and transform data across all current OpenStack core components with work underway to support future OpenStack components.

Ceilometer is a component of the Telemetry project. Its data can be used to provide customer billing, resource tracking, and alarming capabilities across all OpenStack core components.
https://docs.openstack.org/ceilometer/latest/


  • OpenStack cloud is to set up security options that go beyond password-based user authentication when you create a new instance
the OpenStack Dashboard, Horizon, to set up a public/private OpenStack keypair to properly protect the instance at launch time.
A Public/private OpenStack keypair works by keeping the public key on the server, and the private key on your local workstation
A public OpenStack ssh key can be injected into an instance on launch, so that it’s ready for you to access using the private key
If you then set up ssh to deny password authentication and instead require the key, you give your instance a much stronger layer of security.

The downside of PuTTY is that it doesn’t like the *.pem format OpenStack gives you, in which the public and private key are together; instead you must separate them using the PuTTYgen client:

https://www.mirantis.com/blog/openstack-security-tip-create-a-keypair-for-accessing-vms/

  • The project code-name for Networking services is neutron. OpenStack Networking handles the creation and management of a virtual networking infrastructure, including networks, switches, subnets, and routers for devices managed by the OpenStack Compute service (nova). Advanced services such as firewalls or virtual private network (VPN) can also be used.

OpenStack Networking consists of the neutron-server, a database for persistent storage, and any number of plug-in agents, which provide other services such as interfacing with native Linux networking mechanisms, external devices, or SDN controller

OpenStack Networking is entirely standalone and can be deployed to a dedicated host. If your deployment uses a controller host to run centralized Compute components, you can deploy the Networking server to that specific host instead

OpenStack Networking integrates with various OpenStack components:

    OpenStack Identity service (keystone) is used for authentication and authorization of API requests.

    OpenStack Compute service (nova) is used to plug each virtual NIC on the VM into a particular network.

    OpenStack Dashboard (horizon) is used by administrators and project users to create and manage network services through a web-based graphical interface.

https://docs.openstack.org/neutron/latest/admin/intro.html

  • Provider networks

Provider networks offer layer-2 connectivity to instances with optional support for DHCP and metadata services. These networks connect, or map, to existing layer-2 networks in the data center, typically using VLAN (802.1q) tagging to identify and separate them.

Subnets

A block of IP addresses and associated configuration state. This is also known as the native IPAM (IP Address Management) provided by the networking service for both project and provider networks. Subnets are used to allocate IP addresses when new ports are created on a network.

Subnet pools

End users normally can create subnets with any valid IP addresses without other restrictions. However, in some cases, it is nice for the admin or the project to pre-define a pool of addresses from which to create subnets with automatic allocation.

Using subnet pools constrains what addresses can be used by requiring that every subnet be within the defined pool. It also prevents address reuse or overlap by two subnets from the same pool.

Ports

A port is a connection point for attaching a single device, such as the NIC of a virtual server, to a virtual network. The port also describes the associated network configuration, such as the MAC and IP addresses to be used on that port.


Routers

Routers provide virtual layer-3 services such as routing and NAT between self-service and provider networks or among self-service networks belonging to a project. The Networking service uses a layer-3 agent to manage routers via namespaces.

Security groups

Security groups provide a container for virtual firewall rules that control ingress (inbound to instances) and egress (outbound from instances) network traffic at the port level.
Security groups use a default deny policy and only contain rules that allow specific traffic.
Each port can reference one or more security groups in an additive fashion. The firewall driver translates security group rules to a configuration for the underlying packet filtering technology such as iptable

Each project contains a default security group that allows all egress traffic and denies all ingress traffic. 
You can change the rules in the default security group. If you launch an instance without specifying a security group, the default security group automatically applies to it. Similarly, if you create a port without specifying a security group, the default security group automatically applies to it.

Security group rules are stateful. Thus, allowing ingress TCP port 22 for secure shell automatically creates rules that allow return egress traffic and ICMP error messages involving those TCP connections.

By default, all security groups contain a series of basic (sanity) and anti-spoofing rules

Although non-IP traffic, security groups do not implicitly allow all ARP traffic. Separate ARP filtering rules prevent instances from using ARP to intercept traffic for another instance. You cannot disable or remove these rules.

You can disable security groups including basic and anti-spoofing rules by setting the port attribute port_security_enabled to False.

https://docs.openstack.org/neutron/latest/admin/intro-os-networking.html