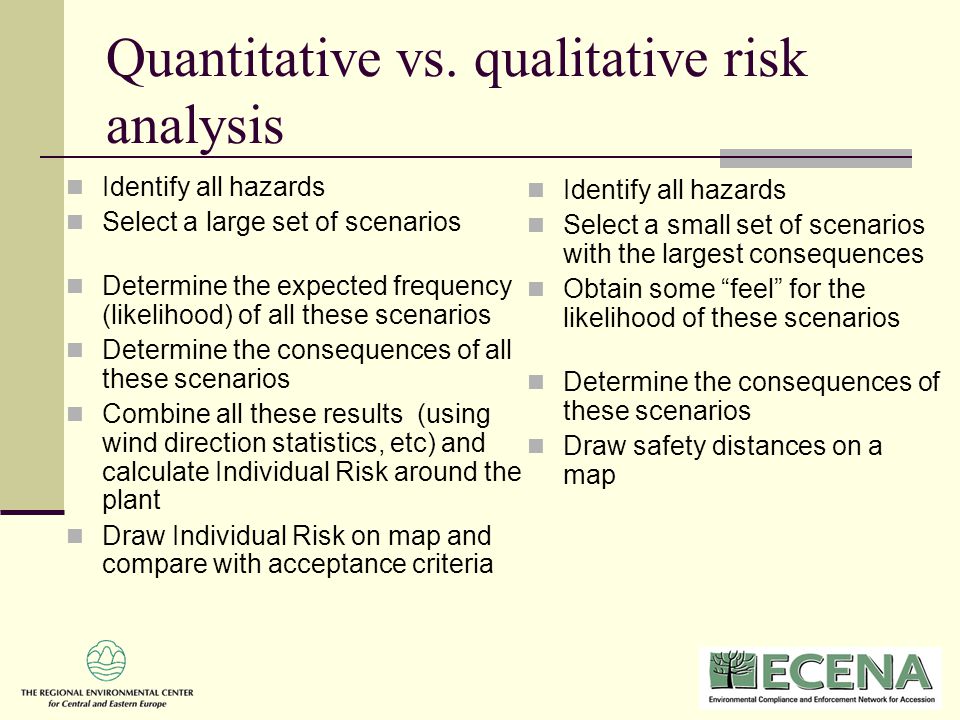
Risk analysis can b e divided
Quantitative Risk Analysis
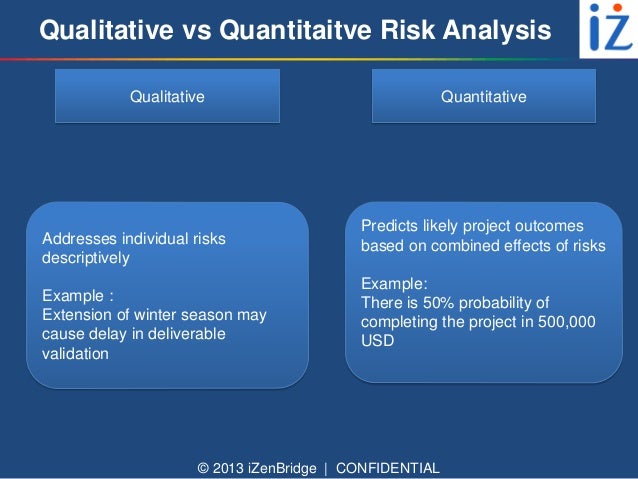
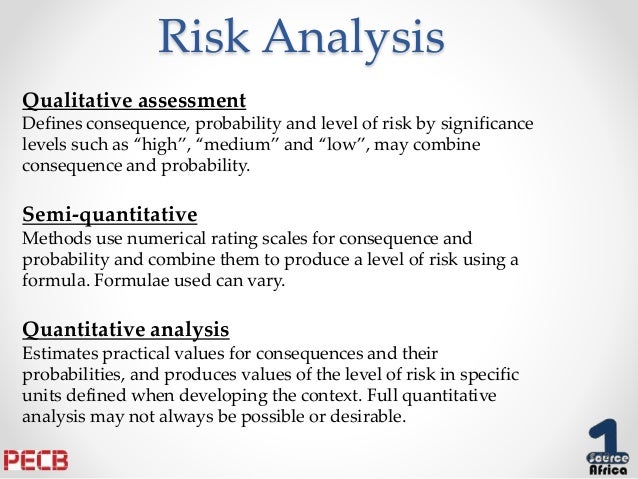
Qualitative Risk Analysis
Quantitative Risk Analysis:
A Quantitative risk analysis attempts to assign an objective are measured
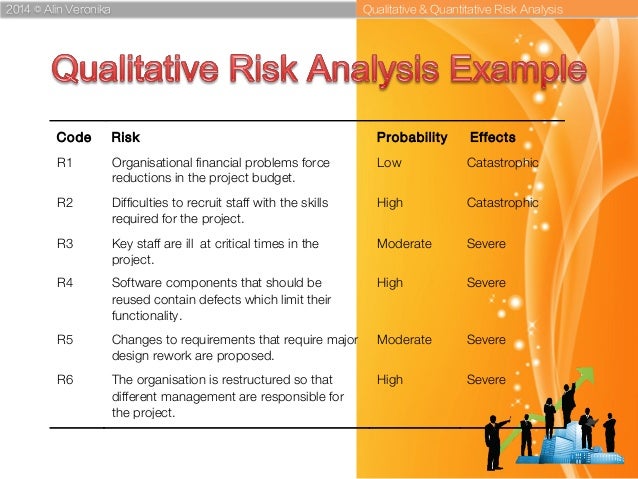
Qualitative Risk Analysis:
A qualitative risk analysis is scenario-driven and doesn’t attempt to analysis
Risk Control is a safeguard or
RISK REDUCTION:
Mitigating risk by implementing the necessary be achieved risk
RISK ASSIGNMENT:
To avoid the outcomes of risk, we can assign the potential loss associated with a risk to a third party, such as an insurance company.
RISK ACCEPTANCE:
It involves the acceptance of the loss associated with a potential risk.
https://resources.infosecinstitute.com/risk-management-concepts/#gref


- Qualitative and Quantitative Risk Analysis
Qualitative or Quantitative?
Understanding Qualitative Risk Analysis
The
Understanding Quantitative Risk Analysis
Quantitative risk analysis is more focused on
http://www.brighthubpm.com/risk-management/33403-qualitative-and-quantitative-risk-analysis/
- Information gathering techniques
Delphi technique
- Calculating Expected Monetary Value (EMV)
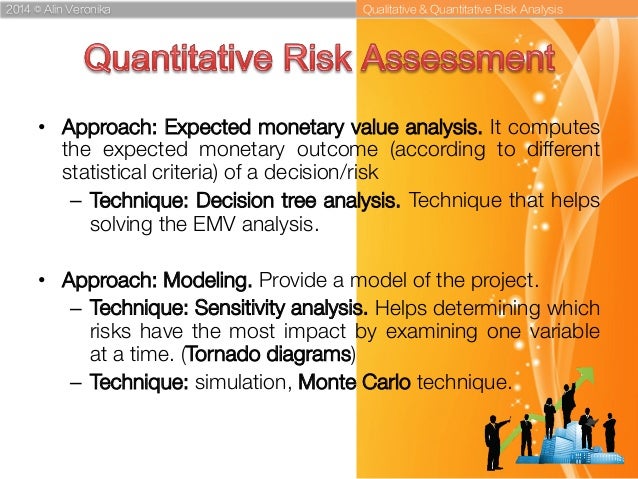
Expected Monetary Value analysis (EMV)
Quantitative risk analysis & modeling techniques- commonly used for event-oriented
Expected Monetary Value analysis (EMV)
http://www.clarizen.com/community/clarizen-training-center/how-to-articles/advanced-practices/Risk-Management-Useful-Tools-and-Techniques-how-to.html
Expected Monetary Value is a recommended tool and technique for Quantitative Risk Analysis in Project Risk Management.
Suppose you are leading a construction project. Weather, cost of construction material, and labor turmoil are key project risks found in most
Project Risks 1 - Weather: There is a 25% chance of excessive snow fall that’ll delay the construction for two weeks which will
Project Risks 2 - Cost of Construction Material: There is a 10% probability of the price of construction material dropping, which will save the project $100,000.
Project Risks 3 - Labor Turmoil: There is a 5% probability of construction coming to a halt if the workers go on strike. The impact would lead to a loss of $
though this example is from the construction industry, the theory
In this Expected Monetary Value example, we have two negative project risks (Weather and Labor Turmoil) and a positive project risks (Cost of Construction Material). The Expected Monetary Value for the project risks:
Weather: 25/100 * (-$80,000) = - $ 20,000
Cost of Construction Material: 10/100 * ($100,000) = $ 10,000
Labor Turmoil: 5/100 * (-$150,000) = - $7,500
This means that if the:
Weather negative project risks occurs, the project loses $20,000,
Cost of Construction Material positive project risks occurs, the project gains $10,000, and
Labor Turmoil negative project risks occurs the project loses $ 7,500EMVFinal
The project’s Expected Monetary Value based on these project risks is:
Therefore, if all risks occur in the construction project, the project would lose $17,500. In this scenario, the project manager can add $17,500 to the budget to compensate for this. This is a simplistic Expected Monetary Value calculation example. Another technique used to calculate complex Expected Monetary Value calculations is by conducting Decision Tree Analysis.
http://www.brighthubpm.com/risk-management/48245-calculating-expected-monetary-value-emv/
- Monte Carlo Technique
Modeling and Simulation
http://www.pmpnotes.com/pmp-notes/risk-management/
- What is Monte Carlo simulation?
Monte Carlo simulation is a computerized mathematical technique that allows people to account for risk in quantitative analysis and decision making. The technique
Monte Carlo simulation furnishes the decision-maker with a range of
The technique was first used by scientists working on the atom bomb;
http://www.palisade.com/risk/monte_carlo_simulation.asp
- CRAMM
http://www.cramm.com
- CRAMM (CCTA Risk Analysis and Management Method) is a risk management
methodology , currently
CRAMM comprises three stages, each supported by
https://en.wikipedia.org/wiki/CRAMM
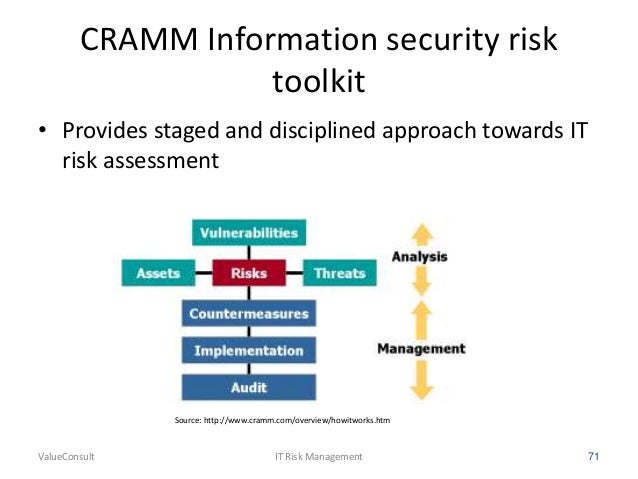
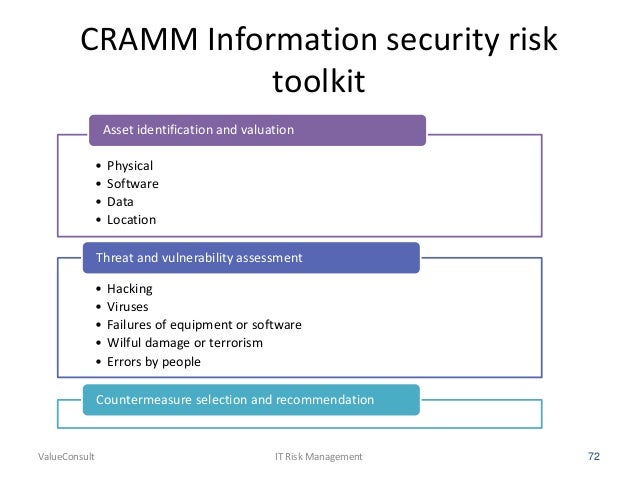
- CRAMM is a risk analysis method developed by the British government organization CCTA (Central Communication and Telecommunication Agency), now renamed
zhe were based CRAMM is also used
https://www.enisa.europa.eu/topics/threat-risk-management/risk-management/current-risk/risk-management-inventory/rm-ra-methods/m_cramm.html
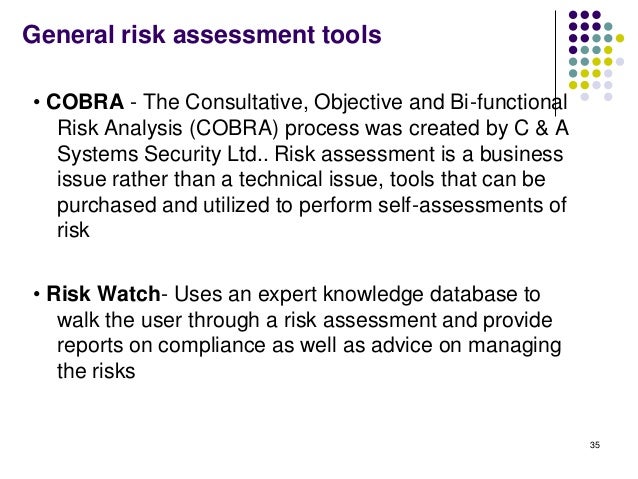
- Cobra software tool enables
security be undertaken evaluates vulnerabilities, be examined stand alone without any be further customized
https://www.enisa.europa.eu/topics/threat-risk-management/risk-management/current-risk/risk-management-inventory/rm-ra-tools/t_cobra.html
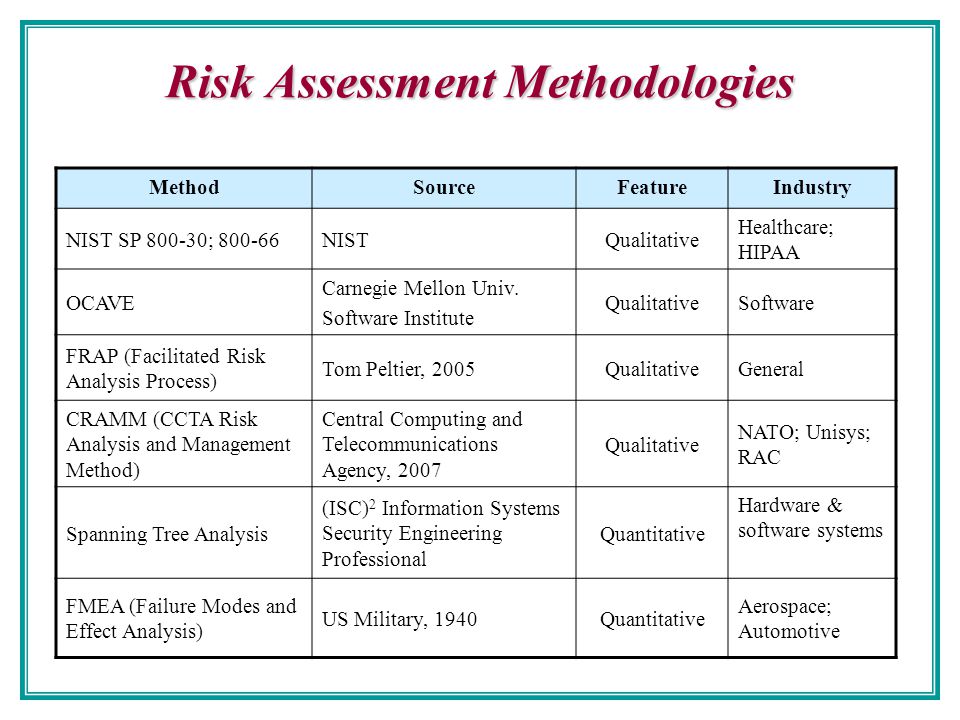
- What Are Some Common Risk Assessment/Management Methodologies and Tools? There are
numerous The following methodologies and tools were developed
•National Institute of Standards & Technology (NIST)
•OCTAVE®
•FRAP
•COBRA
•Risk Watch
7.4 COBRA
https://www.sans.org/reading-room/whitepapers/auditing/introduction-information-system-risk-management-1204

- EAR / Pilar
http://rm-inv.enisa.europa.eu/methods_tools/t_EAR_Pilar.html
- Magerit is an open methodology for Risk Analysis and Management, developed by the Spanish Ministry of Public Administrations, offered as a framework and guide to the Public Administration. Given its open nature it is also used outside the Administration.
Magerit v2 has been structured into three books:
Book I: Methodology. It describes the core steps and basic tasks to carry out a project for risk analysis and management; the formal description of the project; the application to the development of information systems and it provides a large number of practical clues, as well as the theoretical foundations, together with some other complementary information.
Book II: Catalogue of elements. It provides standard elements and criteria for information systems and risk modeling: asset classes, valuation dimensions, valuation criteria, typical threats, and safeguards to be considered; it also describes the reports containing the findings and conclusions (value model, risk map, safeguard evaluation, risk status, deficiencies report and security plan), thus contributing to achieve uniformity.
Book III: Practical techniques. It describes techniques frequently used to carry out risk analysis and management projects such as: tabular and algorithmic analysis; threat trees, cost-benefit analysis, dataflow diagrams, process charts, graphical techniques, project planning, working sessions (interviews, meetings, presentations), and Delphi analysis. The application of the methodology can be supported by the software PILAR / EAR, which exploits and increases its potentialities and effectiveness (PILAR is limited to the Spanish Public Administration. EAR is a commercial product).
https://www.enisa.europa.eu/topics/threat-risk-management/risk-management/current-risk/risk-management-inventory/rm-ra-methods/m_magerit.html
Ebios
http://rm-inv.enisa.europa.eu/methods_tools/t_ebios.html
- Risk Assessment Methodologies
FAIR (Factor Analysis of Information Risk)
NIST RMF (National Institute of Standards and Technology’s Risk Management Framework)
OCTAVE (Operationally Critical Threat, Asset and Vulnerability Evaluation) tools, techniques, and methods that
FAIR (Factor Analysis of Information Risk) is a framework for comprehending, examining and
https://miguelbigueur.com/2015/08/02/risk-assessment-methodologies/#more-864
- SP 800-30 Rev. 1
Guide for Conducting Risk Assessments
The purpose of Special Publication 800-30 is to provide guidance for conducting risk assessments of federal information systems and organizations, amplifying the guidance in Special Publication 800-39.
https://csrc.nist.gov/publications/detail/sp/800-30/rev-1/final
- The goal of risk management is to deliver optimal security at a reasonable cost.
CIA Triad
Confidentiality is about not disclosing sensitive information to other people
Integrity is about preserving the state of the system—we don’t want attackers to change our data
We
Quantitative analysis is about assigning monetary values to risk components.
Let’s analyze the example of a hard drive failure to better understand how it works.
Let’s first describe the threat, vulnerability, and risk.
Threat—hard drive failure
Vulnerability—backups done rarely
Risk—loss of data
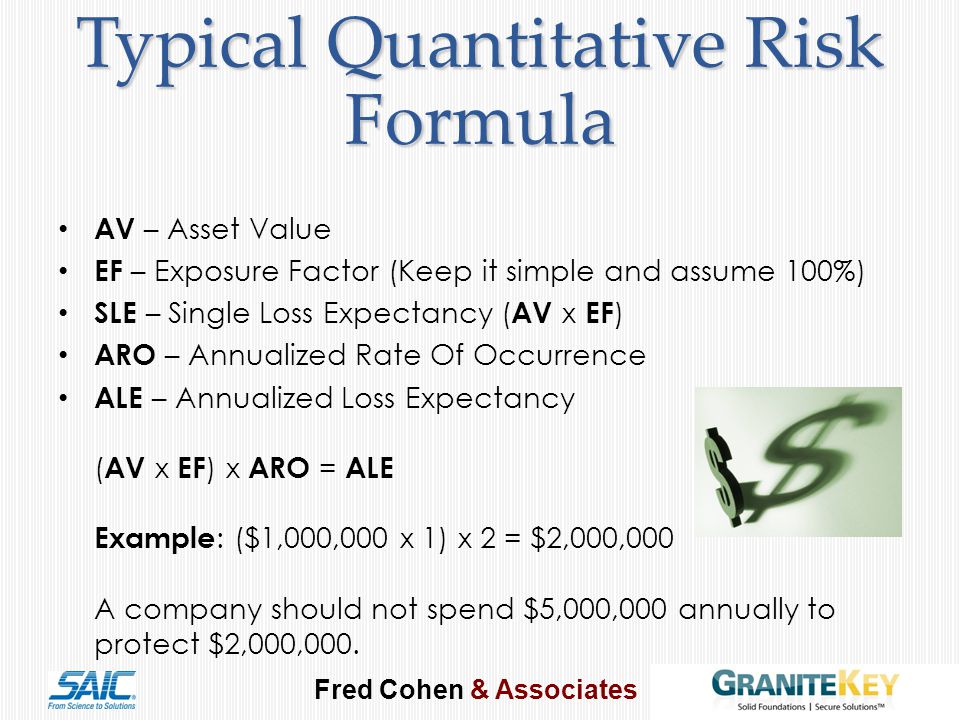
The asset is data. The value of the asset (AV)
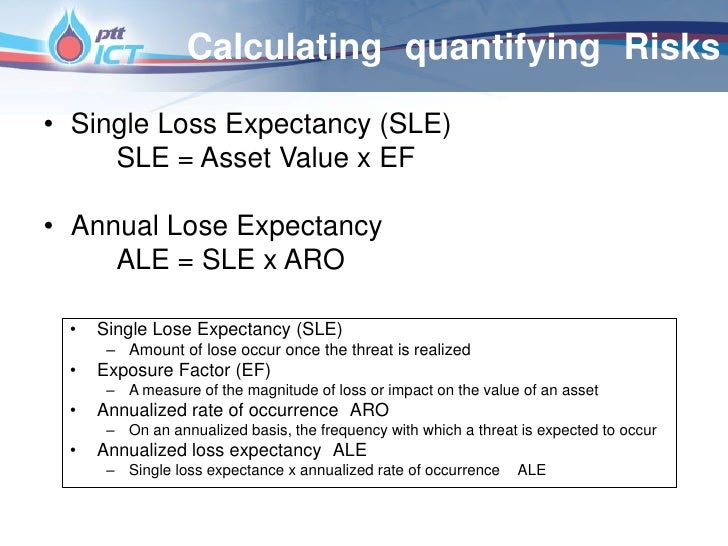
Let’s discuss the single loss expectancy (SLE).
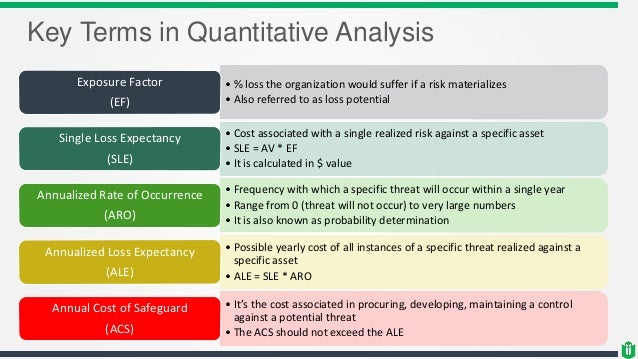
It contains information about the potential loss when a threat occurs (expressed in monetary values).
SLE = AV x EF
where EF is an exposure factor
Exposure factor describes the loss that will happen to the asset
SLE is $30,000 in our example when EF
The annualized rate of occurrence (ARO)
ALE = SLE x ARO
ALE is $15,000 ($30,000 x 0.5)
when ARO
Cost/Benefit Analysis
Let’s continue the example from the previous section.
Annualized loss expectancy (ALE) is $15,000.
This means that the potential loss is $15,000 in one year when the data
It happens when the management
This countermeasure should not cost more than $15,000 per year
it wouldn’t be logical from a business point of view (we don’t want to spend more money than we
the annual value of the countermeasure to the company
COUNTERMEASURE_VALUE = ALE_PREVIOUS
ALE_PREVIOUS: ALE before implementing the countermeasure
ALE_NOW: ALE after implementing the countermeasure
COUTERMEASURE_COST: the annualized cost of countermeasure (please note
Risk Handling
Risk reduction—the risk
Risk avoidance—stopping the activity, which leads to the risk
Risk transference—the risk
Risk acceptance—accepting the cost of potential loss (no countermeasures)
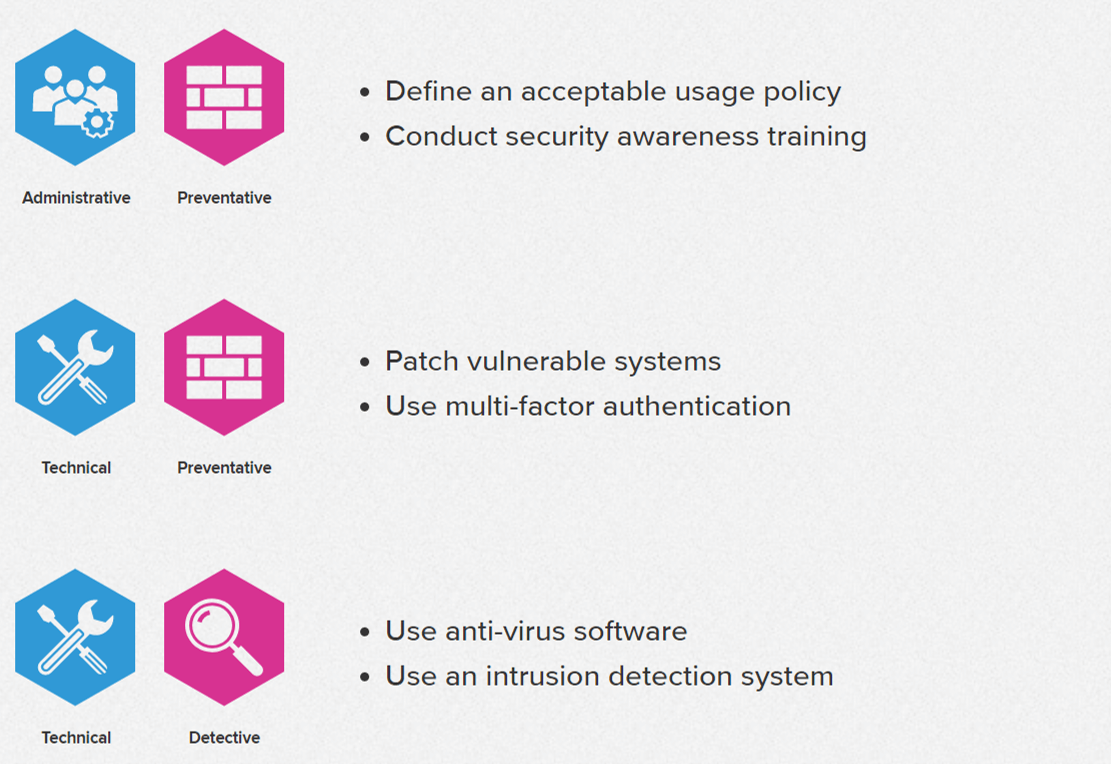
Countermeasures
the
three types of countermeasures:
Administrative (e.g., security awareness training should not
Technical (e.g., firewall)
Physical (e.g., locks)
https://resources.infosecinstitute.com/quantitative-risk-analysis/#gref


- Red Hat Enterprise Linux 4
Security Guide
1.2. Security
Physical
Technical
Administrative
These three broad categories define the main objectives of proper security implementation
1.2.1. Physical
Closed-circuit surveillance cameras
Motion or thermal alarm systems
Security guards
Picture IDs
Locked and dead-bolted steel doors
Biometrics (includes
1.2.2. Technical
Encryption
Smart cards
Network authentication
Access control lists (ACLs)
File integrity auditing software
1.2.3. Administrative
Training and awareness
Disaster preparedness and recovery plans
Personnel recruitment and separation strategies
Personnel registration and accounting
https://web.mit.edu/rhel-doc/4/RH-DOCS/rhel-sg-en-4/s1-sgs-ov-controls.html
- Detective Administrative Controls
• Security reviews and audits.
• Performance evaluations.
• Required vacations.
• Background investigations.
• Rotation of duties.
http://www.blacksheepnetworks.com/security/info/
- The annualized loss expectancy (ALE)
is computed
The annualized rate of occurrence (ARO)
ALE = SLE x ARO
The annualized loss expectancy (ALE) is the product of the annual rate of occurrence (ARO) and the single loss expectancy (SLE). It
Suppose that
The annualized loss expectancy is the product of the annual rate of occurrence (ARO) and the single loss expectancy. ALE = ARO *
For an annual rate of occurrence of one, the annualized loss expectancy is 1 * $25,000, or $25,000.
For an ARO of three, the equation is: ALE = 3 * $25,000. Therefore: ALE = $
https://en.wikipedia.org/wiki/Annualized_loss_expectancy
- the annualized loss expectancy for a website against the threat of attack is $82,000
After implementing a new web application firewall, the new annualized loss expectancy would be $20,000
The web application firewall costs $55,000 per year to implement and maintain
single loss expectancy × annualized rate of occurrence = ALE
the value of the web application firewall to the company:
(ALE before
82,000 -20,000 -55,000 = 7000
The web application firewall saves the company in loss expenses:
82000-20000 = 62000
.jpg)
.jpg)
A small office for a company is valued
the single loss expectancy (SLE) for the facility suffering from a fire?
asset value ($600,000) × exposure factor (75%) = $450,000
single loss expectancy (SLE)
asset value × exposure factor (EF) = SLE
.jpg)
- FAILURE MODE & EFFECTS ANALYSIS (FMEA)
https://asq.org/quality-resources/fmea
- FMEA — failure mode and effects analysis — is a tool for identifying potential problems and their impact.
FMEA is a qualitative and systematic tool, usually created within a spreadsheet, to help practitioners
https://www.isixsigma.com/tools-templates/fmea/fmea-quick-guide/
- Information Risk Assessment
Methodology
The ISF’s Information Risk Assessment
https://www.securityforum.org/tool/information-risk-assessment-
- Open Source Security Testing
Methodology
It has been primarily developed methodology It is not meant be used as methodology rather is tailored
OSSTMM rules of engagement
At the beginning of a pentesting the following
Project scope
Confidentiality and non-disclosure assurance
Emergency contact information
Statement of work change process
Test plan
Test process
Reporting standards
OSSTMM channels
OSSTMM test cases cover most of the 10 security domains identified by the International Information System Security Certification Consortium (ISC) They are divided
Human security focuses on assessing personnel security awareness levels and the effectiveness of the security training in the organisation.
Physical security assesses access controls, security processes and physical locations such as buildings, perimeters and military bases.
Wireless communications covers different forms of be intercepted
Telecommunications covers the different communication channels in the organisation, including VoIP, PBX and voicemail
Data networks is the channel which focuses on computer and network security and describes the following activities
Network surveying
Identification
Access process
Service identification
Authentication
Spoofing
Phishing
Resource abuse
OSSTMM uses the concept of modules, defining them as a set of processes or phases which are
The four modules defined by OSSTMM are:
Phase I: Regulatory
Phase II: Definitions
Phase III: Information phase
Phase IV: Interactive controls test phase
https://www.futurelearn.com/courses/ethical-hacking-an-introduction/1/steps/522778

- Threat and Risk Assessment Working Guide
This document entitled Threat and Risk Assessment Working Guide provides guidance to an individual (or a departmental team) carrying out a Threat and Risk Assessment (TRA) for an existing or proposed IT system.
http://www.iwar.org.uk/comsec/resources/risks/itsg-04e.pdf
- Information Security Policy Templates
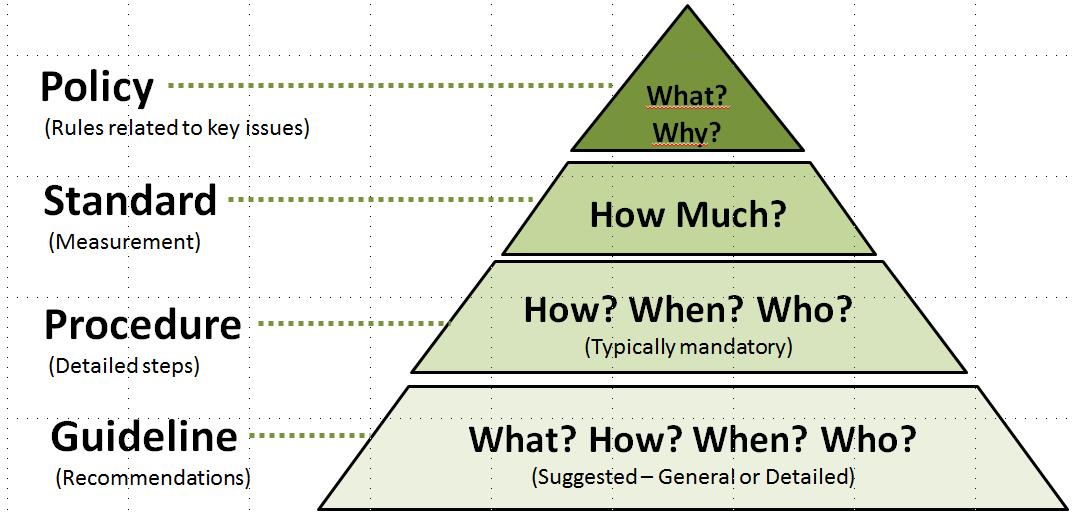
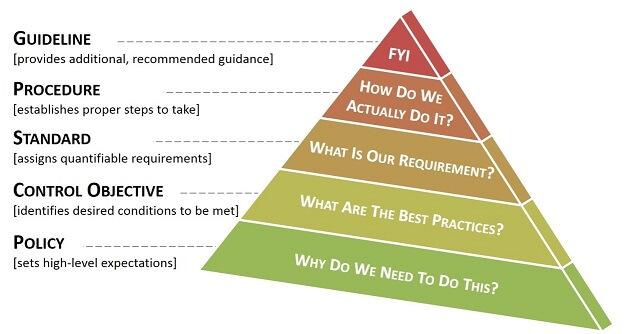
Is it a Policy, a Standard or a Guideline?
A policy is typically a document that outlines specific requirements or rules that must be met . In the information/network security realm, policies are usually point -specific, covering a single area. For example, an "Acceptable Use" policy would cover the rules and regulations for appropriate use of the computing facilities
A standard is typically a collection of system-specific or procedural-specific requirements that must be met by everyone . For example, you might have a standard that describes how to harden a Windows 8.1 workstation for placement on an external (DMZ) network.
A guideline is typically a collection of system specific or procedural specific "suggestions" for best practice. They are not requirements to be met , but are strongly recommended .
https://www.sans.org/security-resources/policies


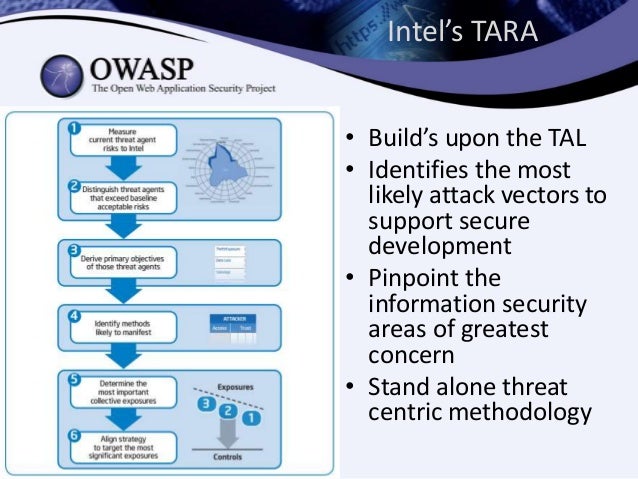
- Top 10 Questions for the Threat Agent Risk Assessment (TARA) methodology
What is the purpose of TARA?
TARA is a method to distill the immense number of possible threats into a manageable picture of the most likely attacks to occur, based upon the objectives and methods of those who possess the capability and desire to do harm.
Why should my organization incorporate TARA?
TARA can help if your organization is challenged with building a practical, accurate, and comprehensive security risk analysis which scales and adapts to the changing risk landscape.
What are the primary benefits of TARA?
I have seen 3 primary areas of benefit.
1. Greatly distilling the cloud of potential attacks, down to a manageable list of likely attacks
2. Improving the quality of risk and control evaluations, to better understand the value of security investments
3. Communicating risks and recommendations to management and non-security audiences
Is TARA a tool, application, device, or checklist?
TARA is a way of analyzing risks (risk of loss) based upon the relationship between attacker’s capability and desire to cause loss, the applicable vulnerabilities, controls, and the residual exposures. The method can be incorporated into risk analysis tools, applications, and processes.
https://itpeernetwork.intel.com/top-10-questions-for-the-threat-agent-risk-assessment-tara-methodology/#gs.1k5alx


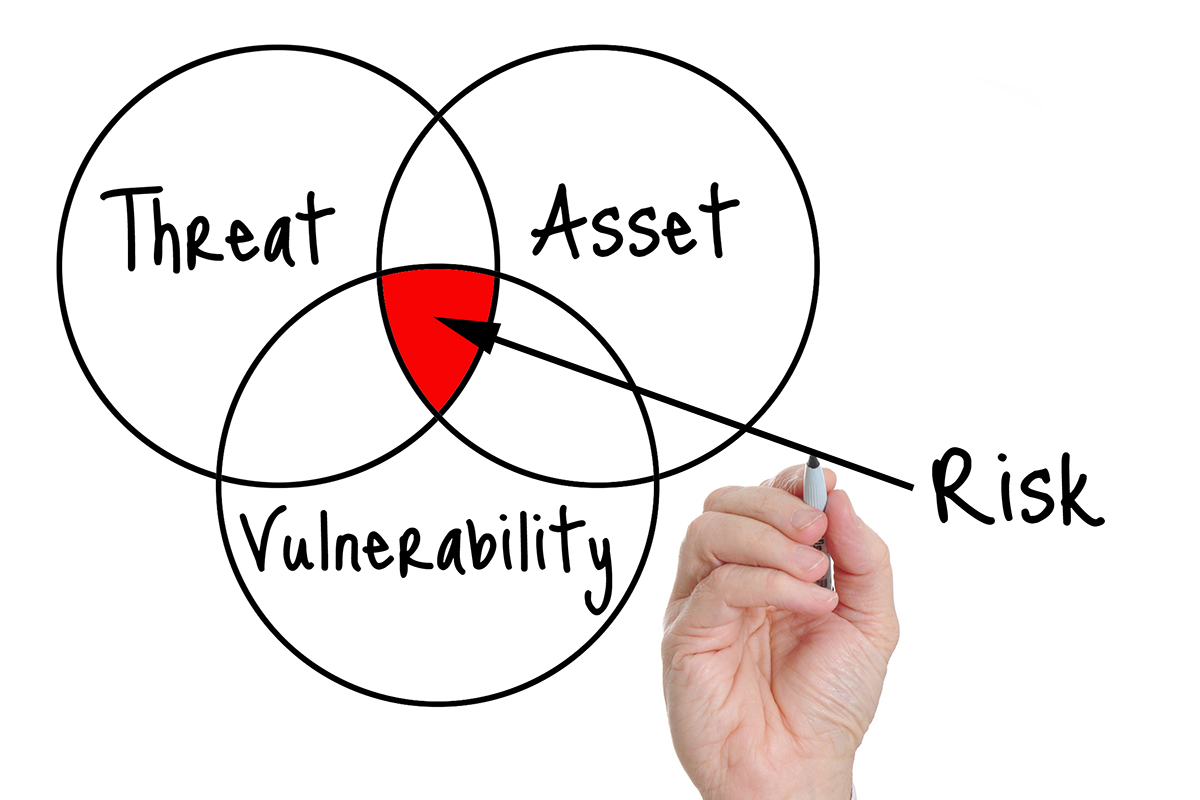
- An asset is what we’re trying to protect.
Asset – People, property, and information.
Threat – Anything that can exploit a vulnerability, intentionally or accidentally, and obtain, damage, or destroy an asset.
A threat is what we’re trying to protect against.
Vulnerability – Weaknesses or gaps in a security program that can be exploited by threats to gain unauthorized access to an asset.
A vulnerability is a weakness or gap in our protection efforts.
Risk – The potential for loss, damage or destruction of an asset as a result of a threat exploiting a vulnerability.
Risk is the intersection of assets, threats, and vulnerabilities.
https://www.threatanalysis.com/2010/05/03/threat-vulnerability-risk-commonly-mixed-up-terms/


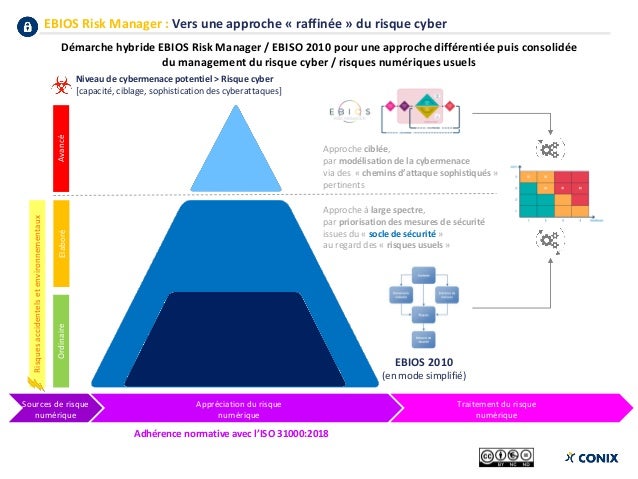
- EBIOS Risk Manager (EBIOS RM) is the method for assessing and treating digital risks, published by National Cybersecurity Agency of France (ANSSI) with the support of Club EBIOS. It provides a toolbox that can be adapted, of which the use varies according to the objective of the project. EBIOS Risk Manager is compatible with the reference standards in effect, in terms of risk management as well as in terms of cybersecurity.
The EBIOS RM method can be used for several purposes:
setting up or reinforcing a management process of the digital risk within an organisation;
assess and treat the risks relating to a digital project, in particular with the aim of a security accreditation;
define the level of security to be achieved for a product or service according to its use cases and the risks to be countered, in the perspective of a certification or accreditation for example.
https://www.ssi.gouv.fr/guide/ebios-risk-manager-the-method/