- Life Data Analysis (Weibull Analysis)
An Overview of Basic Concepts
In life data analysis (also called "Weibull analysis"), the practitioner attempts to make predictions about the life of all products in the population by fitting a statistical distribution to life data from a representative sample of units. The parameterized distribution for the data set can then be used to estimate important life characteristics of the product such as reliability or probability of failure at a specific time, the mean life and the failure rate. Life data analysis requires the practitioner to:
Gather life data for the product.
Select a lifetime distribution that will fit the data and model the life of the product.
Estimate the parameters that will fit the distribution to the data.
Generate plots and results that estimate the life characteristics of the product, such as the reliability or mean life.
https://www.weibull.com/basics/lifedata.htm
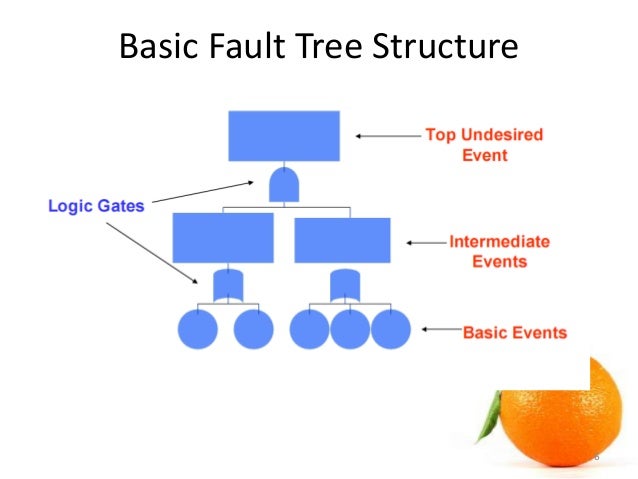
- Fault tree analysis (FTA) is a top-down, deductive failure analysis in which an undesired state of a system is analyzed using Boolean logic to combine a series of lower-level events. This analysis method is mainly used in the fields of safety engineering and reliability engineering to understand how systems can fail, to identify the best ways to reduce risk or to determine (or get a feeling for) event rates of a safety accident or a particular system level (functional) failure
https://en.wikipedia.org/wiki/Fault_tree_analysis
The fault tree analysis (FTA) was first introduced by Bell Laboratories and is one of the most widely used methods in system reliability, maintainability and safety analysis. It is a deductive procedure used to determine the various combinations of hardware and software failures and human errors that could cause undesired events (referred to as top events) at the system level.
Fault tree construction
To do a comprehensive FTA, follow these steps:
Define the fault condition, and write down the top level failure.
Using technical information and professional judgments, determine the possible reasons for the failure to occur. Remember, these are level two elements because they fall just below the top level failure in the tree.
Continue to break down each element with additional gates to lower levels. Consider the relationships between the elements to help you decide whether to use an "and" or an "or" logic gate.
Finalize and review the complete diagram. The chain can only be terminated in a basic fault: human, hardware or software.
If possible, evaluate the probability of occurrence for each of the lowest level elements and calculate the statistical probabilities from the bottom up.
http://asq.org/quality-progress/2002/03/problem-solving/what-is-a-fault-tree-analysis.html
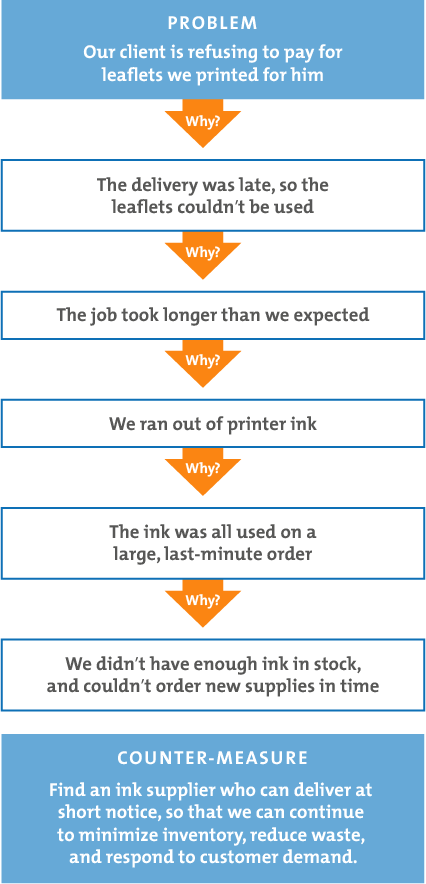
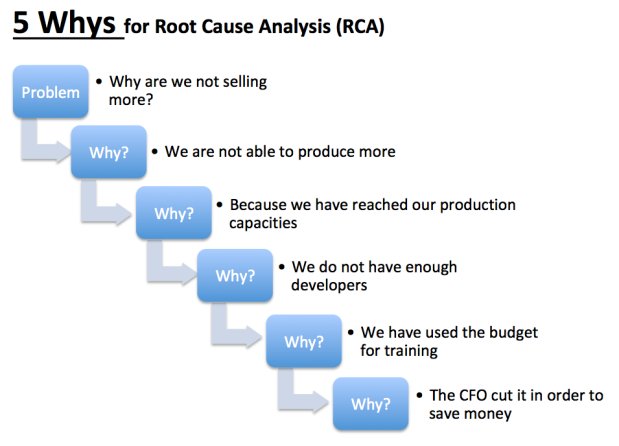
- when a problem occurs, you drill down to its root cause by asking "why?" five times.
Then, when a counter-measure becomes apparent, you follow it through to prevent the issue from recurring.
The 5 Whys uses "counter-measures," rather than solutions. A counter-measure is an action or set of actions that seeks to prevent the problem arising again, while a solution may just seek to deal with the symptom. As such, counter-measures are more robust, and will more likely prevent the problem from recurring.
You can use 5 Whys for troubleshooting, quality improvement and problem solving, but it is most effective when used to resolve simple or moderately difficult problems.
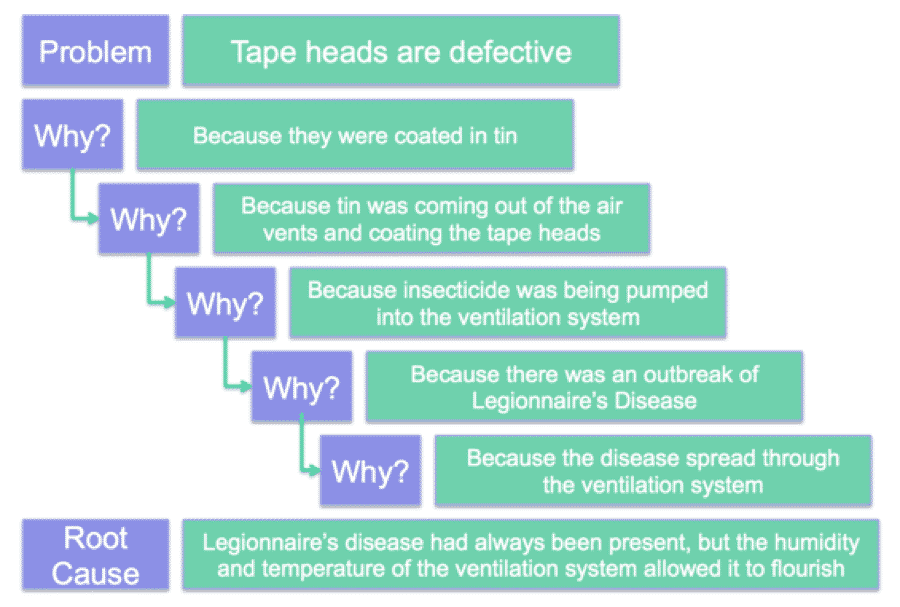
5 Whys is an iterative interrogative technique used to explore the cause-and-effect relationships underlying a particular problem
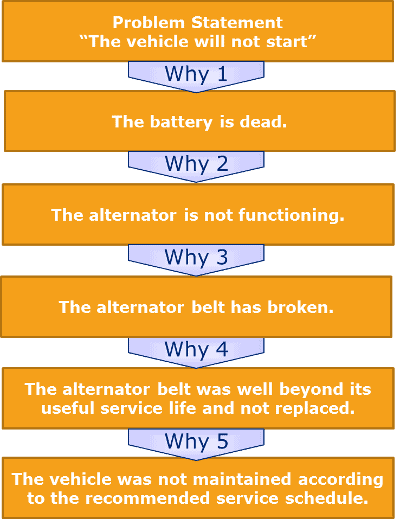
The vehicle will not start. (the problem)
Why? - The battery is dead. (First why)
Why? - The alternator is not functioning. (Second why)
Why? - The alternator belt has broken. (Third why)
Why? - The alternator belt was well beyond its useful service life and not replaced. (Fourth why)
Why? - The vehicle was not maintained according to the recommended service schedule. (Fifth why, a root cause)
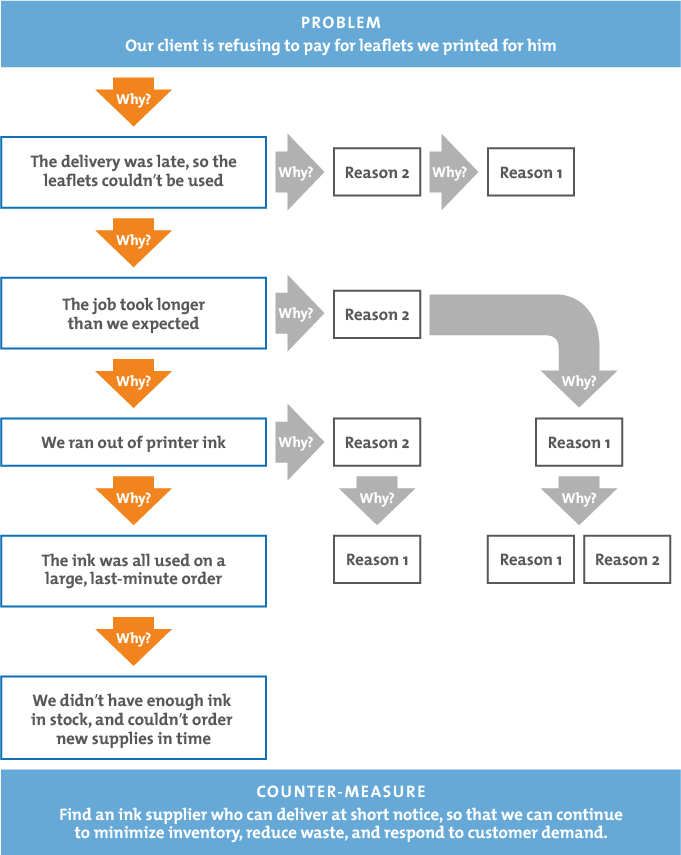
Two primary techniques are used to perform a 5 Whys analysis:
the fishbone (or Ishikawa) diagram
a tabular format
These tools allow for analysis to be branched in order to provide multiple root causes.
Criticism
Tendency for investigators to stop at symptoms rather than going on to lower-level root causes.
Inability to go beyond the investigator's current knowledge - cannot find causes that they do not already know.
Lack of support to help the investigator ask the right "why" questions.
Results are not repeatable - different people using 5 Whys come up with different causes for the same problem.
Tendency to isolate a single root cause, whereas each question could elicit many different root causes.
https://en.wikipedia.org/wiki/5_Whys
https://www.mindtools.com/pages/article/newTMC_5W.htm
- When Should I Use Structured Problem Solving?
It is important to use the right tool for the task at hand. This is a powerful method that takes some time to plan and use. As a result, it only makes sense to use it on medium or large problems.Finally, this process is useful to apply when you are facing an unfamiliar or frustrating problem.
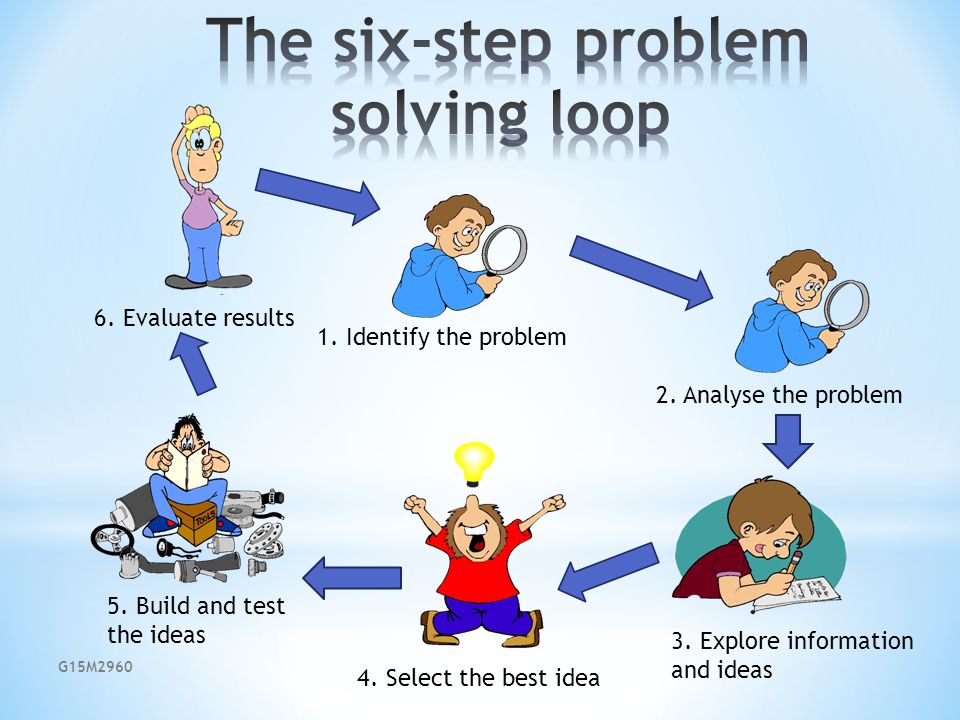
The 6 Step Process For Problem Solving
Step 1: Identify the problem
2. Structure the problem
3. Develop solutions
4. Select a solution to the problem
5. Implement a solution
6. Monitor for success
http://projectmanagementhacks.com/how-to-use-structured-problem-solving/
- five problem-solving tools that can each be used to look at a particular problem from a different perspective
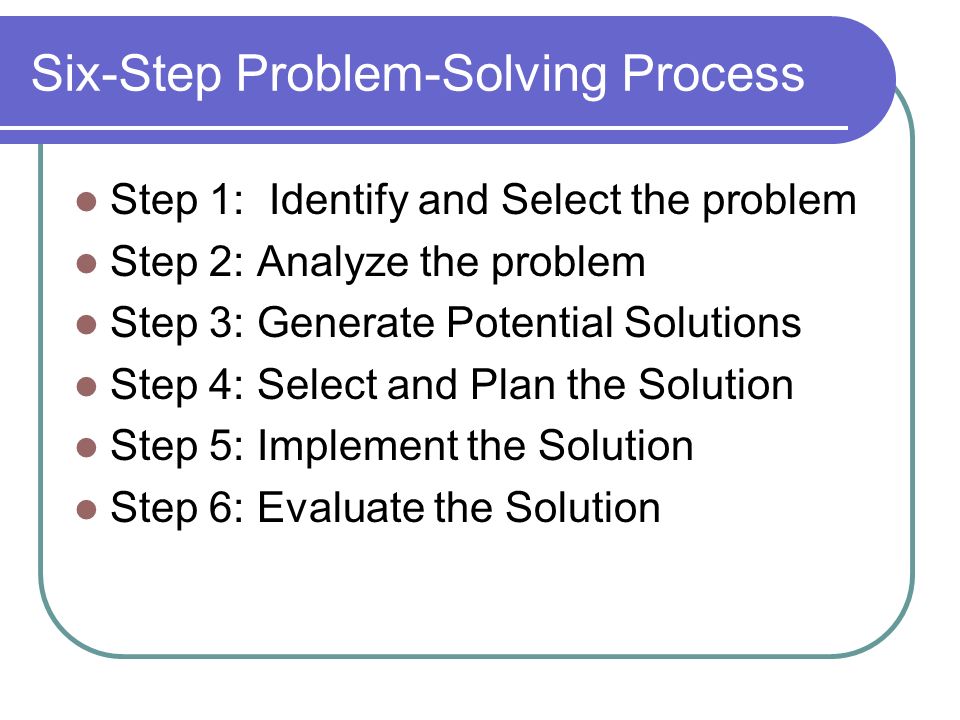
1-Six-Step Problem Solving Model
Each step must be completed before moving on to the next step. However, the steps are repeatable. At any point the group can return to an earlier step, and proceed from there
The process is one of continuous improvement. The goal is not to solve but
to evolve, adjusting the solution continually as new challenges emerge,
through repeating the Six Step Process.
Step One: Define the Problem
At this stage groups will use techniques such as: Brainstorming Interviewing Questionnaires
Step Two: Determine the Root Cause(s) of the Problem
In this step the problem solving team will use tools such as: Fishbone diagrams Pareto analysis Affinity diagrams
Step Three: Develop Alternative Solutions
Techniques include: Force field analysis SWOT Porters five forces
Step Five: Implement the Solution
The group may use tools, such as a Gantt chart, timeline or log frame
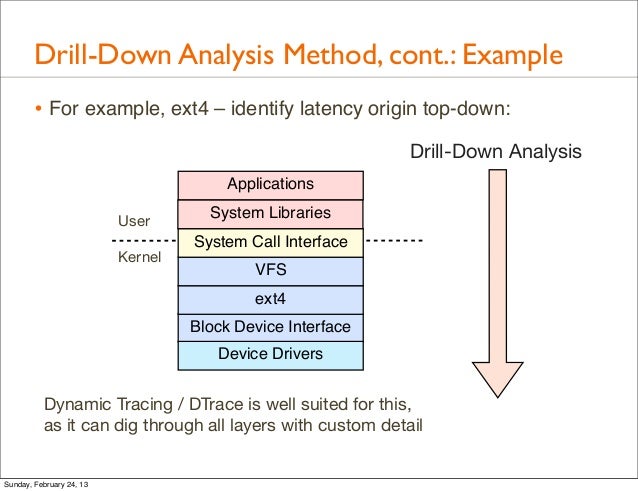
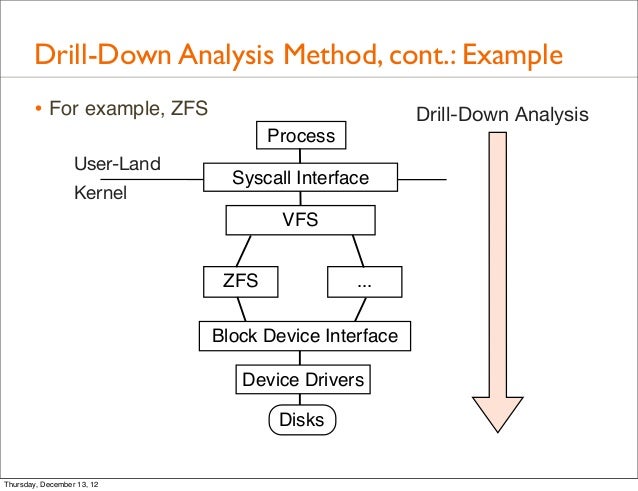
2-The Drill Down Technique
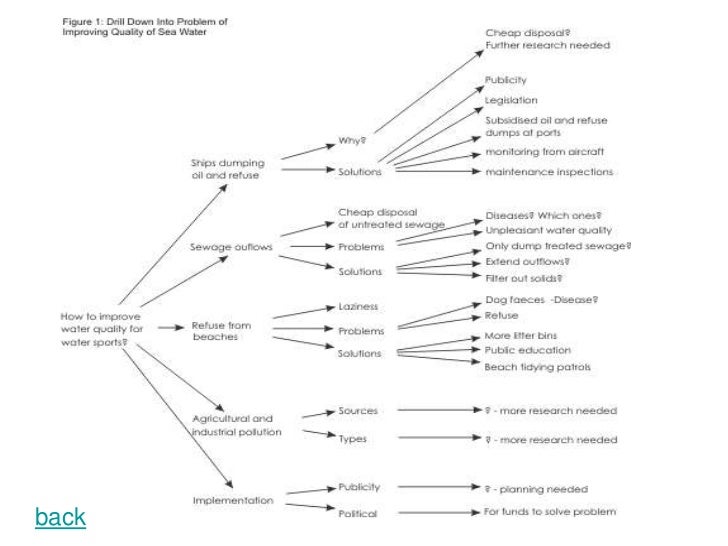
Drill down is a simple technique for breaking complex problems down into progressively smaller parts.
- Start by writing the problem down on the left-hand side of a large sheet of paper.
- On the right of each point, write down the points that make up the next level of detail.
- Repeat this process, for each new point that you identify.
- Keep on drilling down until you have identified all of the factors contributing to the original problem.
- This technique can be used in conjunction with the 5 Why Analysis to ensure that you investigate each aspect of the problem.
You can choose to work through this process either on your computer or with a pen on a piece of paper;
To start, write down the problem that you are facing in big letters at the top of the page. Try to sum up the problem in just a word or a short phrase, even if it is complicated in nature.
you are going to break down the problem into three to five smaller issues that make up the big problem.
This process will continue until you simply can’t drill down any farther. Once you have reached what you consider to be the bottom of your chart, you will be finished and you can begin to look for solutions among what you have created.
Specifically, the five whys method matches up with this line of thinking in a number of ways. Both methods are focused on getting to the heart of the problem rather than just fixing the top level issue, and both methods ask you to think about the operation of your business as a whole, instead of just the factors immediately related to the problem in front of you.
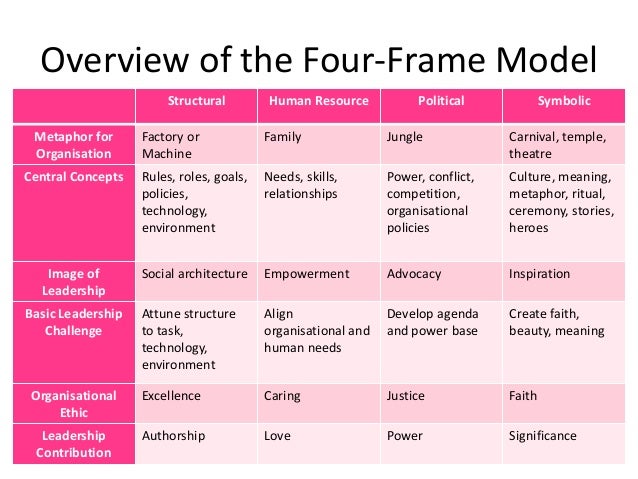
3-The Four Frame Model
The Four Frame Model is designed to help you understand and approach issues about organizational problems, development, and change.
It views organizations in four frames representing separate metaphors: structural (factories or machines), human resource (personal relationships), political (jungles or battles for power), and symbolic (theatre or drama).
Each of these frames can be thought of as a different perspective or way of looking at things, which can help you to see the same situation in a variety of ways.
The structural frame focuses on the architecture of the organization. This includes goals, structure, technology, roles and relationships.
The human resource frame emphasizes individual needs, feelings, fears, prejudices, skills, and development opportunities.
The political frame emphasizes power and competition, taking into account diverse beliefs, interests, behaviors, and skills.
The symbolic frame treats organizations as theatre or drama focusing on meaning and faith.
With each of the four frames, the interested organizational observer can view the same situation in at least four ways.
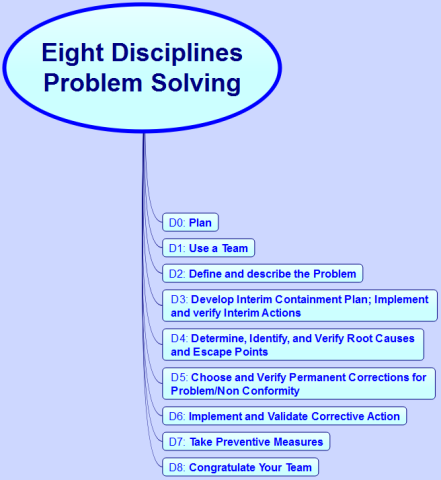
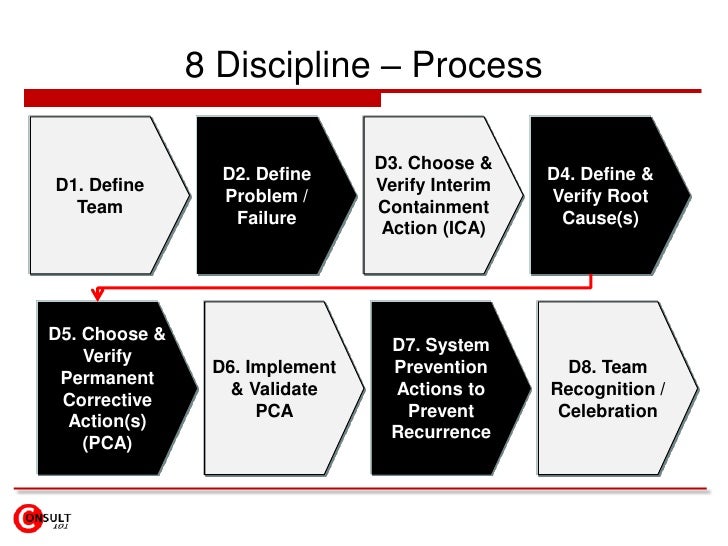
4-The Eight Disciplines Problem Solving
The Eight Disciplines Problem Solving procedure is focused on product and process improvement, its purpose is to identify, correct, and eliminate recurring problems.
It aims to establish a permanent corrective action based on fixing the origin of the problem by determining the root cause.
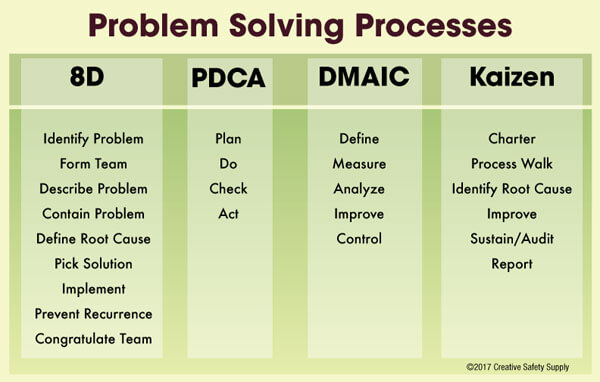
Once a problem has been recognized, the 8 disciplines used to solve;
Team Formation, Problem Description, Implementing Interim Containment Actions, Defining Problem Root Causes, Developing Permanent Corrective Actions, Implementing Permanent Corrective Actions, Preventing Reoccurrences, and Recognizing and Congratulating the Team.
Once the problem has been resolved, the team should publish and release a final report along with lessons learned.
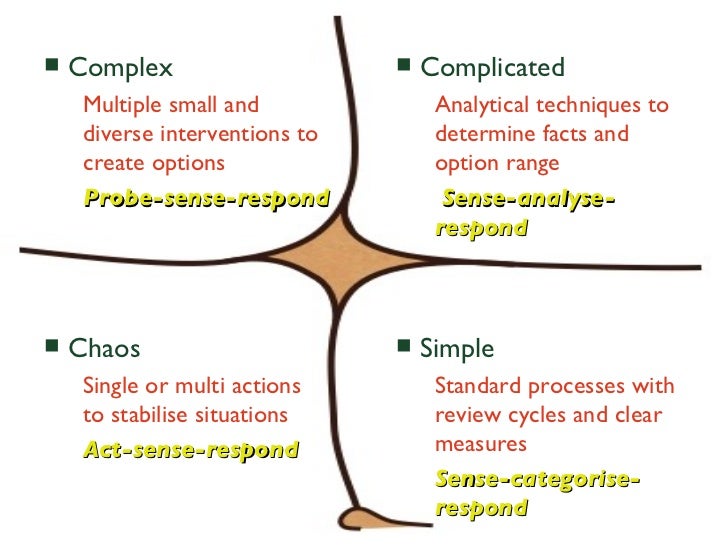
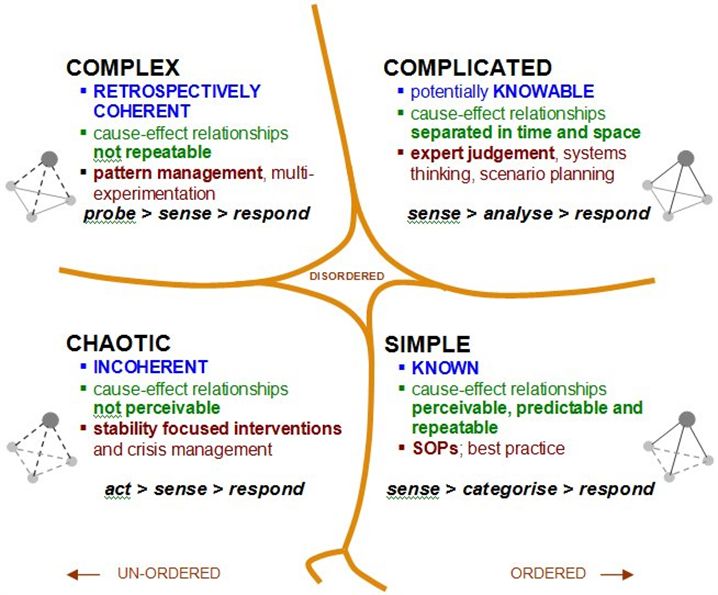
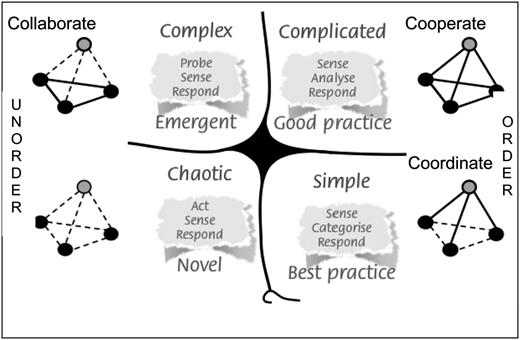
5-The Cynefin Framework
The Cynefin Framework helps you figure out how you should be thinking about a problem rather than providing a method for solving it.
The core of this framework is the way that it breaks down problems into one of five contexts.
The idea is to place the problem that you are facing into one of these specific contexts, which will then help you decide how that problem needs to be approached.
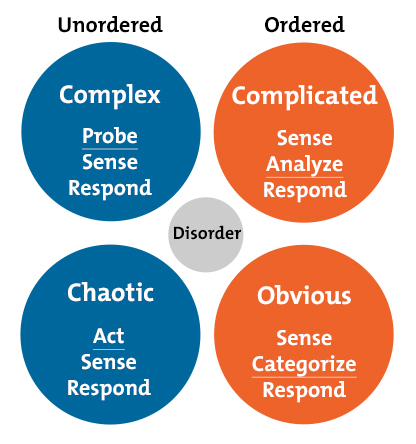
The five contexts are: Obvious, Complicated, Complex, Chaotic and Disorder.
Obvious: Are self-explanatory and the cause and effect relationships that you need to uncover are right there for you to see.
Complicated: Are those that are usually best left to experts in the specific field in question.
Complex: Might not have a clear solution at the present time. You don’t necessarily need an expert in order to solve this problem; you may just need more time and information.
Chaotic: There is no obvious connection between cause and effect. Once action has been taken and the problem has been mitigated as thoroughly as possible, you can then work toward removing the chaos and gaining a better understanding of what is going on.
Disorder: The state of not knowing what type of causality exists, in which state people will revert to their own comfort zone in making a decision.
Once you identify where in this framework your problems are found, you can then start to solve them using a variety of other means and methods.
http://www.free-management-ebooks.com/dldebk-pdf/fme-top-5-problem-solving-tools.pdf
- a conceptual framework used to aid decision-making
it has been described as a "sense-making device"
Cynefin is a Welsh word for habitat
Cynefin offers five decision-making contexts or "domains"—obvious (known until 2014 as simple)
complicated, complex, chaotic, and disorder—that help managers to identify how they perceive situations and make sense of their own and other people's behaviour.
https://en.wikipedia.org/wiki/Cynefin_framework
- Non-abstract Large System Design Interview Preparation (My Path to SRM)
NALSD describes a skill critical to SRE: the ability to assess, design, and evaluate large systems. Practically, NALSD combines elements of capacity planning, component isolation, and graceful system degradation that are crucial to highly available production systems.
Google SREs are expected to be able to start resource planning with a basic whiteboard diagram of a system, think through the various scaling and failure domains, and focus their design into a concrete proposal for resources
Design an image sharing service like Imgur and come up with a bill of materials for serving 50.000 Queries per second (QPS).
Design a log ingestion service like Stackdriver including indexing pipeline and frontend. Highlight the tradeoff differences of the components.
Design an approach to distributed rate limiting of an API that can handle one million QPS hitting the API endpoints. Optimize for less cross-regional bandwidth and come up with a reasonable bill of materials.
https://danrl.com/blog/2019/path-to-srm-nalsd/
- Introducing Non-Abstract Large System Design
By following an iterative style of system design and implementation, we arrive at robust and scalable designs with low operational costs. We call this style Non-Abstract Large System Design (NALSD).
NALSD describes a skill critical to SRE: the ability to assess, design, and evaluate large systems. Practically, NALSD combines elements of capacity planning, component isolation, and graceful system degradation that are crucial to highly available production systems. Google SREs are expected to be able to start resource planning with a basic whiteboard diagram of a system, think through the various scaling and failure domains, and focus their design into a concrete proposal for resources. Because these systems change over time, it’s vitally important that an SRE is able to analyze and evaluate the key aspects of the system design.
Why “Non-Abstract”?
All systems will eventually have to run on real computers in real datacenters using real networks.
AdWords Example
The Google AdWords service displays text advertisements on Google Web Search. The click-through rate (CTR) metric tells advertisers how well their ads are performing. CTR is the ratio of times the ad is clicked versus the number of times the ad is shown.
Design Process
Google uses an iterative approach to design systems that meet our goals
the NALSD process has two phases, each with two to three questions.
In the basic design phase, we try to invent a design that works in principle. We ask two questions:
Is it possible?
Can we do better?
In the next phase, we try to scale up our basic design—for example, by dramatically increasing a requirement. We ask three questions:
Is it feasible?
Is it resilient?
Can we do better?
With these concepts in mind, let’s walk through the iterative NALSD process.
Initial Requirements
when iterating on the design, we will consider our requirements in terms of SLOs
https://landing.google.com/sre/workbook/chapters/non-abstract-design/

Service level objectives (SLOs) specify a target level for the reliability of your service.
Why SREs Need SLOs
https://landing.google.com/sre/workbook/chapters/implementing-slos/
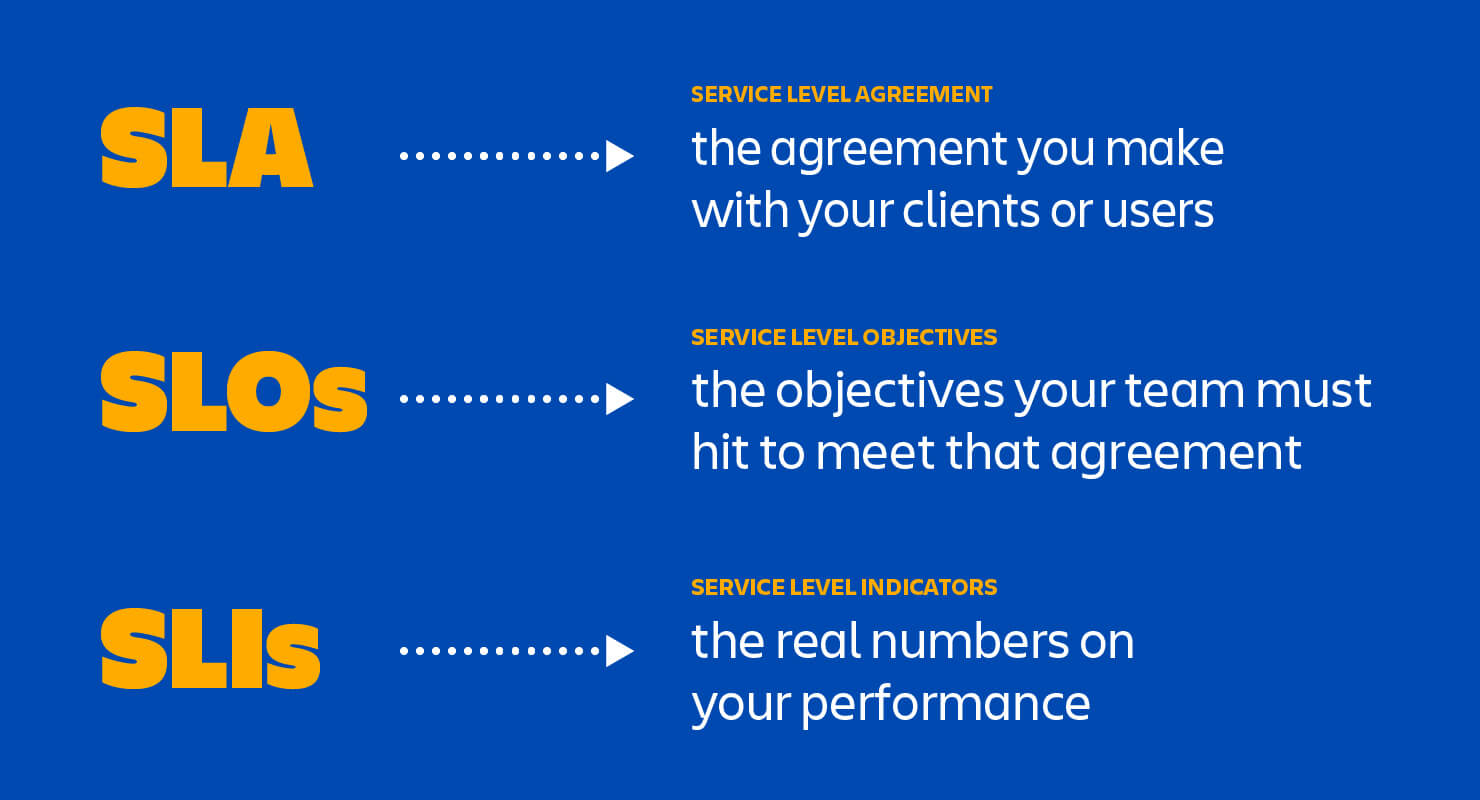
- Service Level Terminology
Indicators
An SLI is a service level indicator—a carefully defined quantitative measure of some aspect of the level of service that is provided.
Most services consider request latency—how long it takes to return a response to a request—as a key SLI. Other common SLIs include the error rate, often expressed as a fraction of all requests received, and system throughput, typically measured in requests per second.
Another kind of SLI important to SREs is availability, or the fraction of the time that a service is usable. It is often defined in terms of the fraction of well-formed requests that succeed, sometimes called yield. (Durability—the likelihood that data will be retained over a long period of time—is equally important for data storage systems.)
For example, availabilities of 99% and 99.999% can be referred to as "2 nines" and "5 nines" availability, respectively, and the current published target for Google Compute Engine availability is “three and a half nines”—99.95% availability.
Objectives
An SLO is a service level objective: a target value or range of values for a service level that is measured by an SLI.
A natural structure for SLOs is thus SLI ≤ target, or lower bound ≤ SLI ≤ upper bound. For example, we might decide that we will return Shakespeare search results "quickly," adopting an SLO that our average search request latency should be less than 100 milliseconds.
Choosing an appropriate SLO is complex. To begin with, you don’t always get to choose its value! For incoming HTTP requests from the outside world to your service, the queries per second (QPS) metric is essentially determined by the desires of your users, and you can’t really set an SLO for that.
Agreements
Finally, SLAs are service level agreements: an explicit or implicit contract with your users that includes consequences of meeting (or missing) the SLOs they contain. The consequences are most easily recognized when they are financial—a rebate or a penalty—but they can take other forms. An easy way to tell the difference between an SLO and an SLA is to ask "what happens if the SLOs aren’t met?
SRE doesn’t typically get involved in constructing SLAs, because SLAs are closely tied to business and product decisions. SRE does, however, get involved in helping to avoid triggering the consequences of missed SLOs. They can also help to define the SLIs: there obviously needs to be an objective way to measure the SLOs in the agreement, or disagreements will arise.
Whether or not a particular service has an SLA, it’s valuable to define SLIs and SLOs and use them to manage the service.
SREs’ core responsibilities aren’t merely to automate “all the things” and hold the pager. Their day-to-day tasks and projects are driven by SLOs: ensuring that SLOs are defended in the short term and that they can be maintained in the medium to long term.SLOs are a tool to help determine what engineering work to prioritize. For example, consider the engineering tradeoffs for two reliability projects: automating rollbacks and moving to a replicated data store. By calculating the estimated impact on our error budget, we can determine which project is most beneficial to our users
https://landing.google.com/sre/sre-book/chapters/service-level-objectives/