- Chaos engineering techniques
One simple test, for instance, simply deletes half of the data packets coming through the internet connection. Another might gobble up almost all the free memory so the software is scrambling for places to store data.
The tests are often done at a higher level. DevSecOps teams may simply shut down some subset of the servers to see if the various software packages running in the constellation are resilient enough to withstand the failure. Others may simply add some latency to see if the delays trigger more delays that snowball and eventually bring the system to its knees
Almost any resource such as RAM, hard disk space, or database connections is fair game for experimentation. Some tests cut off the resource altogether and others just severely restrict the resource to see how the software behaves when squeezed
Buffer overflow problems, for instance, are relatively easy for chaos tools to expose by injecting too many bytes into a channel.
Fuzzing is also adept at revealing flaws in parsing logic. Sometimes programmers neglect to anticipate all the different ways that the parameters can be configured, leaving a potential backdoor
Bombarding the software with random and semi-structured inputs can trigger these failure modes before attackers find them
Some researchers moved beyond strictly random injection and built sophisticated fuzzing tools that would use knowledge of the software to guide the process using what they often called “white box” analysis
One technique called grammatical fuzzing would begin with a definition of the expected data structure and then use this grammar to generate test data before subverting the definition in hope of identifying a parsing flaw.
Chaos engineering tools
The tools that began as side projects and skunkworks experimentation for engineers, and now growing into trusted parts of many CI/CD pipelines. Many of the tools are staying open-source projects produced by other DevSecOps specialists and shared openly
https://www.csoonline.com/article/3646413/how-chaos-engineering-can-help-devsecops-teams-find-vulnerabilities.html
- Chaos Engineering is the discipline of experimenting on a system in order to build confidence in the system’s capability to withstand turbulent conditions in production.
Even when all of the individual services in a distributed system are functioning properly, the interactions between those services can cause unpredictable outcomes. Unpredictable outcomes, compounded by rare but disruptive real-world events that affect production environments, make these distributed systems inherently chaotic.
Systemic weaknesses could take the form of:
improper fallback settings when a service is unavailable
retry storms from improperly tuned timeouts
outages when a downstream dependency receives too much traffic
cascading failures when a single point of failure crashes
An empirical, systems-based approach addresses the chaos in distributed systems at scale and builds confidence in the ability of those systems to withstand realistic conditions. We learn about the behavior of a distributed system by observing it during a controlled experiment. We call this Chaos Engineering.
CHAOS IN PRACTICE
To specifically address the uncertainty of distributed systems at scale, Chaos Engineering can be thought of as the facilitation of experiments to uncover systemic weaknesses. These experiments follow four steps:
Start by defining ‘steady state’ as some measurable output of a system that indicates normal behavior.
Hypothesize that this steady state will continue in both the control group and the experimental group
Introduce variables that reflect real world events like servers that crash, hard drives that malfunction, network connections that are severed, etc.
Try to disprove the hypothesis by looking for a difference in steady state between the control group and the experimental group.
The harder it is to disrupt the steady state, the more confidence we have in the behavior of the system.
If a weakness is uncovered, we now have a target for improvement before that behavior manifests in the system at large
ADVANCED PRINCIPLES
Build a Hypothesis around Steady State Behavior
Focus on the measurable output of a system, rather than internal attributes of the system. Measurements of that output over a short period of time constitute a proxy for the system’s steady state. The overall system’s throughput, error rates, latency percentiles, etc. could all be metrics of interest representing steady state behavior. By focusing on systemic behavior patterns during experiments, Chaos verifies that the system does work, rather than trying to validate how it work
Vary Real-world Events
Prioritize events either by potential impact or estimated frequency.
Any event capable of disrupting steady state is a potential variable in a Chaos experiment.
Run Experiments in Production
Since the behavior of utilization can change at any time, sampling real traffic is the only way to reliably capture the request path. To guarantee both authenticity of the way in which the system is exercised and relevance to the current deployed system, Chaos strongly prefers to experiment directly on production traffic.
Automate Experiments to Run Continuously
Minimize Blast Radius
While there must be an allowance for some short-term negative impact, it is the responsibility and obligation of the Chaos Engineer to ensure the fallout from experiments are minimized and contained
Where other practices address velocity and flexibility, Chaos specifically tackles systemic uncertainty in these distributed systems.
https://principlesofchaos.org/

- Chaos engineering is the practice of testing a system's response to turbulent behavior, such as infrastructure failures, unresponsive services, or missing components.
The goal is to break the system to correct its architecture, understand its weak points, and anticipate failures and how the system and the people might behave
By using the following principles, you can adopt chaos engineering in many difficult environments and organizations. The principles are relevant to all organizations that want to implement chaos engineering and benefit from the high availability and resilience that it enables
Strengthen reliability disciplines
Understand the system
Experiment on every component
Strive for production
Contain the impact
Measure, learn, improve
Increase complexity gradually
Socialize continuously
Sometimes the terminology is the problem, and executives prefer to replace chaos engineering with continuous disaster recovery to promote its adoption
https://www.ibm.com/cloud/architecture/architecture/practices/chaos-engineering-principles/
- “Chaos Engineering is the discipline of experimenting on a distributed system in order to build confidence in the system’s capability to withstand turbulent conditions in production.”
For VictorOps, SRE is a scientific practice which aims to make data-driven decisions to improve a system’s reliability and scalability—as observed by the customer.
We knew that all simulated service disruptions were going to be taken in our pre-production environment in order to increase our confidence that it wouldn’t impact users.
What if a service in our staging environment is actually talking to something in our production environment? We are still learning its reality. However, we need to “reduce the blast radius” as they say, so our initial exercises will take place in our pre-production “staging” environment.
This means that we need to ask questions about how we can make staging behave (as closely as possible) to the customer-facing environment.
Principles of Chaos:
Build a Hypothesis around Steady State Behavior
Vary Real-world Events
Run Experiments in Production
Automate Experiments to Run Continuously
Minimize Blast Radius
What is the goal of Chaos Day?
Using the principles of chaos engineering we will learn how our system handles failure, then incorporate that information into future development.
What is the goal of our experiments?
This time around, we’re verifying our first round of Black-box Alerts in our staging environment.
What happens if we actually break Staging in a way which takes longer than a day to fix?
We’re aiming to avoid this with back-out criteria for experiments and reset criteria for bad/overloaded data. If, however, a long recovery time is needed, we’ll communicate this and make arrangements with affected teams.
Chaos Team Roles
Recorder
Documenting as much as possible was the first role we wanted to assign—we needed a recorder
Driver
Someone should be responsible for driving the experiments as well:
Incident Commander (Tech Lead)
A technical lead (typically the council representative) would assume the role of the incident commander to be the main point of contact and to maintain a high-level holistic awareness for the experiments
Commander for the day
In addition to team incident commanders, one engineer played the role of the event I.C., communicating across all experiments throughout the day
https://www.splunk.com/en_us/observability/resources/sre-guide-toc/chaos-engineering.html

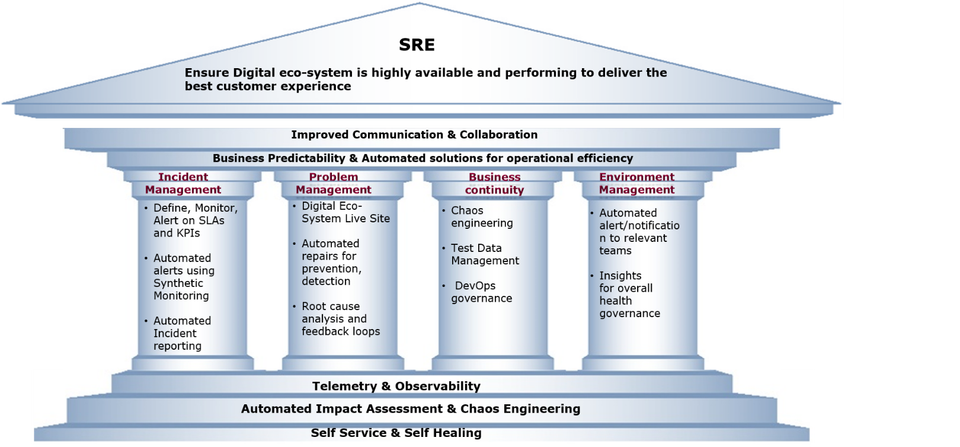
- The core tenets on which SRE works are as follows
- The principles of observability turn your systems into inspectable and debuggable crime scenes, and chaos engineering encourages and leverages observability as it seeks to help you pre-emptively discover and overcome system weaknesses.
- In the practice of Chaos Engineering, observability plays a key role. Validation of hypothesis, steady state behaviour, simulating real-world events, optimizing blast radius are all those stages of your experiments where observability plays a key role
Sources of Observable Data
The four golden signals in a service mesh, viz. latency, traffic, errors & saturation provide us the fundamental data set used for observations
Traffic can be observed across all three pillars for observability.
Latency is observable by measuring the time difference between request and response and analyzing the distribution of that across various actors like client, server, network, communication protocols, etc.
Errors provide insights into configuration issues, your application code and broken dependencies.
Saturation provides insights into the utilization and capacity of your resources.
Logging is a very granular way of observing the data
Metrics complement logging
Traces provide a deep understanding of how data flows in your system.
Observability in Action in a Chaos Experiment
Platform: AWS
Target: Microservice deployed in ECS Cluster
Observability: AppDynamics APM
Chaos Tool: Gremlin
Load Generator: HP Performance Center
Attack Type: Network Packet Loss (Egress Traffic)
Blast Radius: 100% (3 out of 3 containers)
Duration: 29 Minutes
Every dependency in a distributed application is its de-facto Chaos Injection Point
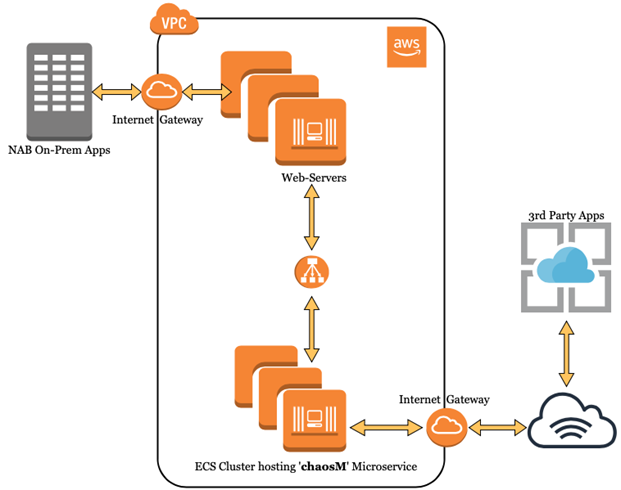
In this article, we specifically demonstrate a scenario of incremental network packet loss for a microservice known as ‘chaosM’ running as part of an AWS ECS cluster
The microservice is running behind a fleet of web-servers. It has 3 task definitions (ECS), balanced across 3 AWS AZs
From a functional view, ‘chaosM’ receives business requests from NAB’s On-Prem Apps, applies the necessary transformation logic before delivering the transformed output to a 3rd-party system, residing outside NAB network
It’s a backend type microservice.
Observed metrics in Steady-state and their deviations in Experiment-state help us validate the hypothesized behaviour of the concerned service.
To observe the steady-state of our micro service, we use metrics called KPIs: Traffic, Errors, Latency & Saturation
our sample ‘chaosM’ micro service is a business integration service designed for data transformation & enrichment. Unlike customer facing services, it does not have business metrics like logins/sec, submission/minute, etc.
Hypothesis
Based on the service’s observability, we make a couple of hypothesis about the microservice:
The incremental Packet Loss attacks of 40%, 60% & 80%, which tries to simulate varying degree of network reliability, will result in a steady increase in latency along with its corresponding error rates (HTTP 500 in this case).
At 100% Packet Loss (a.k.a Blackhole), which simulates a downstream outage, we should be able to validate a 5 sec TCP connect timeout as configured in the ‘chaosM’ microservice
Gremlin’s Failure-as-a-Service (FaaS) Platform is used to design & launch the scenario where we execute 4 incremental network packet loss attacks with increasing intensity i.e. 40%, 60%, 80% & 100% packet loss
Each attack lasts 3 minutes. Also, a 3-minute delay is kept between each successive attack to isolate the observations and allow the service to fall back to steady state between each attack.
Therefore, the total attack window is (3 mins duration x 4 attacks) + (3 mins delay x 3) = (12 + 9) = 21 minutes.
In our observations, we also take into consideration 4 mins before & after the experiment. Hence, total observation window is 29 minutes
The experiment state dashboard represents the same KPIs which helps understand the behaviour of the ‘chaosM’ micro service when it is under attack. We will perform a comparative analysis between steady-state and experiment-state to validate the hypothesis.
Comparative Analysis
The technical insights generated out of the comparative analysis objectively identifies potential weaknesses (in design, coding & configurations) in the system with respect to specific categories of failures
Chaos Engineering experiments do not necessarily make your service totally immune to outages. On the contrary, among many other things, they help you uncover the known-unknowns to validate the robustness of your services.
Latency & Traffic
For the ease of comparison, we have put the SLIs from Steady and Experiment States side-by-side
This rise in Latency is proportional to the magnitude of the Packet Loss attacks, which validates our first hypothesis.
This validates our second hypothesis.
Errors per minute metric has increased exponentially from 0 Error in Steady State to 8 Errors at 40% Packet Loss, 18 Errors at 60% and 56 Errors at 80% Packet Loss
Saturation: CPU, Memory
In Steady state, the CPU utilization metric was reporting 1% across all 3 containers. The same metric in Experiment state has gone up to 2% irrespective of the magnitude of Packet loss.
Experiment has hardly made any difference to memory utilization
Saturation: Network
While the incoming metric shows 300~400 KB/s of incoming data, the corresponding network outgoing metric shows 8000 KB/s during the same time window. Due to these observations, we also concluded that unreliable network, in this case, does not affect resource utilization of our container infrastructure
Observability for a Developer
However, these metrics sometimes show the symptoms of the issue and not necessarily its underlying cause.
An APM monitoring solution can give us insights about the target micro service at the code level & exposes the vulnerable code segments, if any, from a Developer’s perspective.
The code segment Spring Bean — chaosMethod:416 took 38,805 ms or 38.8 Seconds in Experiment State which represents 99.8% of the total execution time. Whereas the same code segment only took 269 ms in Steady State. The 38.8 seconds represents the impact of the packet loss attacks on the code segment Spring Bean — chaosMethod:416.
This code level insights along with the system level visibility coming out of a monitoring (AppDynamics) helps us understand the internal workings of a micro service under various stress conditions & failure scenarios simulated through Chaos Engineering experiments
Observability is only of value when you better understand the data. When you look inside and answer the ‘whys’. You can find answers for both Operators and Developers.
You can discover the known-unknowns and unknown-unknowns once you conduct experiments on your hypothesis.
https://medium.com/@nabtechblog/observability-in-the-realm-of-chaos-engineering-99089226ca51
- The prevailing wisdom is that you will see failures in production; the only question is whether you'll be surprised by them or inflict them intentionally to test system resilience and learn from the experience. The latter approach is chaos engineering.
The idea of the chaos-testing toolkit originated with Netflix’s Chaos Monkey and continues to expand. Today many companies have adopted chaos engineering as a cornerstone of their site reliability engineering (SRE) strategy
https://techbeacon.com/app-dev-testing/chaos-engineering-testing-34-tools-tutorials