A Distributed and High-Performance Monitoring System
http://open-falcon.org/
- Zabbix is a mature and effortless enterprise-class open source monitoring solution for network monitoring and application monitoring of millions of metrics
https://www.zabbix.com/
- Riemann monitors distributed systems
Riemann aggregates events from your servers and applications with a powerful stream processing language.
Send an email for every exception raised by your code. Track the latency distribution of your web app. See the top processes on any host, by memory and CPU. Combine statistics from every Riak node in your cluster and forward to Graphite. Send alerts when a key process
fails to check in. Know how many users signed up right this second.
http://riemann.io/
- Observium is a low-maintenance auto-discovering network monitoring platform supporting a wide range of device types, platforms and operating systems including Cisco, Windows, Linux, HP, Juniper, Dell, FreeBSD, Brocade, Netscaler, NetApp
http://www.observium.org/
- Cockpit makes it easy to administer your GNU/Linux servers via a web browser
http://cockpit-project.org/
- OpenNMS is the world’s first enterprise grade network management application platform developed under the open source model.
http://www.opennms.org/
Cricket is a high performance,
extremely flexible system for monitoring trends in time-series data. Cricket
was expressly developed to help network managers visualize and understand the traffic on their networks, but it can
be used all kinds of other jobs
, as well.
http://cricket.sourceforge.net/
- Munin the monitoring tool surveys all your computers and remembers what it saw. It presents all the information in graphs through a web interface. Its emphasis is on plug and play capabilities. After completing a installation a high number of monitoring plugins will be playing with no more effort.
Using Munin you can easily monitor the performance of your computers, networks, SANs, applications, weather measurements and whatever comes to mind. It makes it easy to determine "what's different today" when a performance problem crops up. It makes it easy to see how you're doing capacity-wise on any resources
http://munin-monitoring.org/
- Monitoring as Code. Use our object based configuration or provision your monitoring code through the REST API. Scale and Secure.
Monitor infrastructures of all sizes with the integrated cluster system secured by SSL
Integrate with many popular DevOps tools and extend
Icinga to meet your needs
https://icinga.com/
- collectd is a daemon which collects system and application performance metrics periodically and provides mechanisms to store the values in a variety of ways, for example in RRD files.
https://collectd.org/
Sending data by using the Monitoring plugin (
collectd)
https://console.bluemix.net/docs/services/cloud-monitoring/send-metrics/conf_monitoring_plugin.html#conf_monitoring_plugin
- Data visualization & Monitoring with support for Graphite, InfluxDB, Prometheus, Elasticsearch and many more databases.
The leading open source software for time series analytics
https://grafana.com/
- Monitor servers, services, application health, and business KPIs. Get notified about failures before your users do. Collect and analyze custom metrics.
Workflow automation for monitoring
From bare metal to
Kubernetes, the
Sensu monitoring event pipeline gives you complete visibility across every system, every protocol, every time.
https://sensu.io/
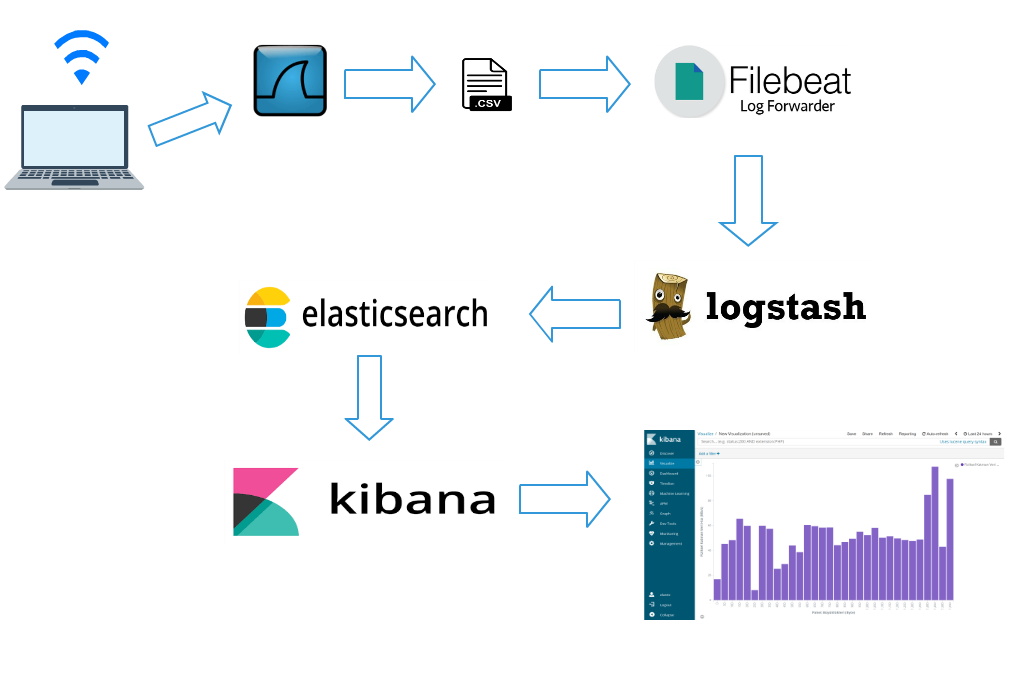
Built on an open source foundation, the Elastic Stack lets you reliably and securely take data from any source, in any format, and search, analyze, and visualize it in real time
https://www.elastic.co/products
- Kibana lets you visualize your Elasticsearch data and navigate the Elastic Stack, so you can do anything from learning why you're getting paged at 2:00 a.m. to understanding the impact rain might have on your quarterly numbers.
https://www.elastic.co/products/kibana
- Logstash is an open source, server-side data processing pipeline that ingests data from a multitude of sources simultaneously, transforms it, and then sends it to your favorite “stash.” (Ours is Elasticsearch, naturally.)
https://www.elastic.co/products/logstash
- Elasticsearch is a distributed, RESTful search and analytics engine capable of solving a growing number of use cases. As the heart of the Elastic Stack, it centrally stores your data so you can discover the expected and uncover the unexpected
https://www.elastic.co/products/elasticsearch
- Lightweight data shippers
Beats is a free and open platform for single-purpose data shippers. They send data from hundreds or thousands of machines and systems to Logstash or Elasticsearch.
https://www.elastic.co/beats/
- What are Examples of Beats?
There are currently six official Beats from Elastic: Filebeat, Metricbeat, Packetbeat, Heartbeat, Winlogbeat, and Auditbeat. All of these beats are open source and Apache-licensed. Elastic maintains a list of regularly updated community beats that users can download, install, and even modify as needed. While each beat has its own distinct use, they all solve the common problem of gathering data at its source and making it easy and efficient to ship that data to Elasticsearch.
Filebeat
Filebeat is designed to read files from your system. It is particularly useful for system and application log files, but can be used for any text files that you would like to index to Elasticsearch in some way. In the logging case, it helps centralize logs and files in an efficient manner by reading from your various servers and VMs, then shipping to a central Logstash or Elasticsearch instance. Additionally, Filebeat eases the configuration process by including “modules” for grabbing common log file formats from MySQL, Apache, NGINX and more
Metricbeat
As the name implies, Metricbeat is used to collect metrics from servers and systems. It is a lightweight platform dedicated to sending system and service statistics. Like Filebeat, Metricbeat includes modules to grab metrics from operating systems like Linux, Windows and Mac OS, applications such as Apache, MongoDB, MySQL and nginx. Metricbeat is extremely lightweight and can be installed on your systems without impacting system or application performance. As with all of the Beats, Metricbeat makes it easy to create your own custom modules.
Packbeat
Packetbeat, a lightweight network packet analyzer, monitors network protocols to enable users to keep tabs on network latency, errors, response times, SLA performance, user access patterns and more. With Packetbeat, data is processed in real time so users can understand and monitor how traffic is flowing through their network. Furthermore, Packetbeat supports multiple application layer protocols, including MySQL and HTTP.
Winlogbeat
Winlogbeat is a tool specifically designed for providing live streams of Windows event logs. It can read events from any Windows event log channel, monitoring log-ons, log-on failures, USB storage device usage and the installation of new software programs. The raw data collected by Winlogbeat is automatically sent to Elasticsearch and then indexed for convenient future reference. Winlogbeat acts as a security enhancement tool and makes it possible for a company to keep tabs on literally everything that is happening on its Windows-powered hosts.
Auditbeat
Auditbeat performs a similar function on Linux platforms, monitoring user and process activity across your fleet. Auditd event data is analyzed and sent, in real time, to Elasticsearch for monitoring the security of your environment.
Heartbeat
Heartbeat is a lightweight shipper for uptime monitoring. It monitors services basically by pinging them and then ships data to Elasticsearch for analysis and visualization. Heartbeat can ping using ICMP, TCP and HTTP. IT has support for TLS, authentication and proxies. Its efficient DNS resolution enables it to monitor every single host behind a load-balanced server.
https://www.objectrocket.com/resource/what-are-elasticsearch-beats/
Graphite is a highly scalable real-time graphing system. As a user, you write an application that collects numeric time-series data
that you are interested in graphing, and send it to Graphite's processing backend, carbon, which stores the data in Graphite's specialized database.
The data can then be visualized through graphite's web interfaces.
Graphite is a free open-source software (FOSS) tool that monitors and graphs numeric time-series data such as
the performance of computer systems
A highly scalable real-time graphing system
https://github.com/graphite-project/graphite-web
Highcharts is a charting library written in pure JavaScript, offering an easy way of adding interactive charts to your
web site or web application.
Highcharts currently supports line, spline, area,
areaspline, column, bar, pie, scatter, angular gauges,
arearange,
areasplinerange,
columnrange, bubble, box plot, error bars, funnel, waterfall and polar chart types.
http://www.highcharts.com/
- Ganglia is a scalable distributed monitoring system for high-performance computing systems such as clusters and Grids. It is based on a hierarchical design targeted at federations of clusters. It leverages widely used technologies such as XML for data representation, XDR for compact, portable data transport, and RRDtool for data storage and visualization
http://ganglia.sourceforge.net/
- Automatically discover your entire network using CDP, FDP, LLDP, OSPF, BGP, SNMP and ARP.
Native iPhone App is available which provides core functionality.
Native Android App is available which provides core functionality..
https://www.librenms.org/
- SmokePing keeps track of your network latency:
Smokeping is a latency measurement tool. It sends test packets out to the net and measures the
amount of time they need to travel from one place to the other and back.
https://oss.oetiker.ch/smokeping/
- Cacti is a complete network graphing solution designed to harness the power of RRDTool's data storage and graphing functionality. Cacti provides a fast poller, advanced graph templating, multiple data acquisition methods, and user management features out of the box
https://cacti.net/
- System Monitoring Using NAGIOS, Cacti, and Prism
Cacti uses Round Robin Databases (RRD) and MySQL database technologies to store collected
information.
MySQL and PHP is used to provide a graphical,
web based interface to the RRD databases.
Rrd database technology was popularized in the widely known MRTG graphing project.
https://cug.org/5-publications/proceedings_attendee_lists/CUG09CD/S09_Proceedings/pages/authors/11-15Wednesday/14A-Davis/davis-paper.pdf
- Drill down into individual containers, gaining protocol level views of an application's behavior. Easily find application errors & bottlenecks.
https://sysdig.com/opensource/sysdig/
- Power your metrics and alerting with a leading open-source monitoring solution
https://prometheus.io/
- Scalable datastore for metrics, events, and real-time analytics
https://github.com/influxdata/influxdb
- cAdvisor (Container Advisor) provides container users an understanding of the resource usage and performance characteristics of their running containers. It is a running daemon that collects, aggregates, processes, and exports information about running containers. Specifically, for each container it keeps resource isolation parameters, historical resource usage, histograms of complete historical resource usage and network statistics. This data is exported by container and machine-wide.
https://github.com/google/cadvisor
Forget using SSH when you have tens, hundreds, or even thousands of servers, virtual machines, and containers generating logs.
Filebeat helps you keep the simple things simple by offering a lightweight way to forward and centralize logs and files
https://www.elastic.co/products/beats/filebeat
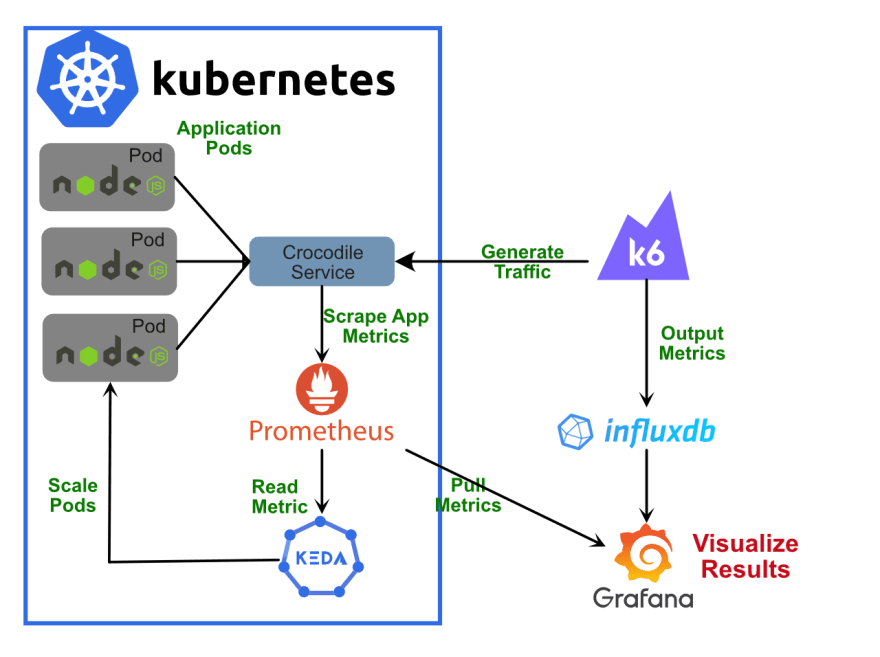
- Prometheus + InfluxDB + Grafana
Heapster or Prometheus as a data aggregator
InfluxDB as storage backend
Grafana as a data visualization platform
Prometheus has become the de facto standard for
Kubernetes data aggregation
All the components are open source
Prometheus + ELK stack (
ElasticSearch + Logstash + Kibana)
Prometheus is used as a data aggregator
ElasticSearch as storage backend
Logstash as a logging manager
Kibana as a data visualization platform.
All the components are open source
https://medium.com/containerum/4-tools-to-monitor-your-kubernetes-cluster-efficiently-ceaf62818eea
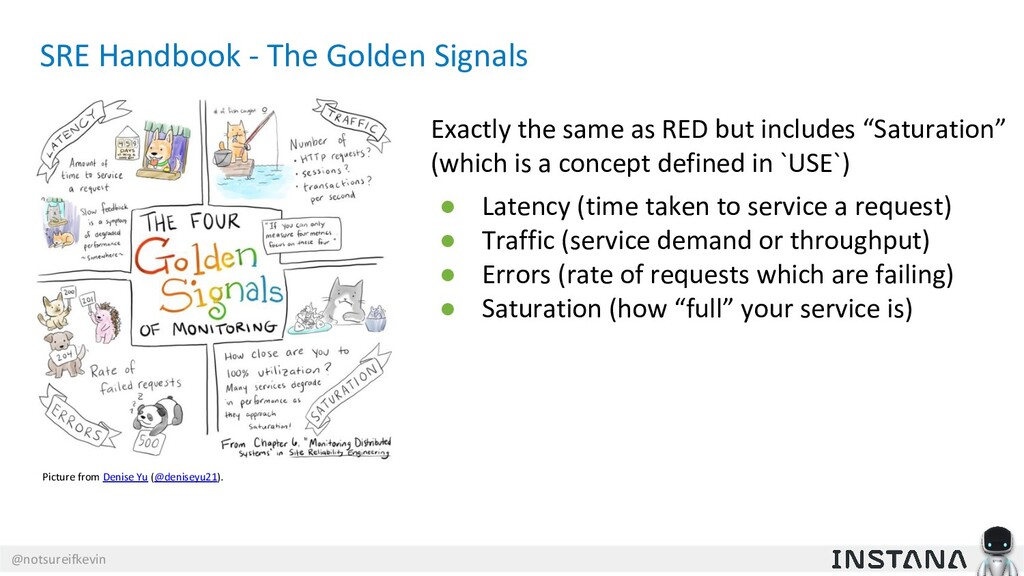
- Monitoring SRE's Golden Signals
These signals are especially important as we move to
microservices and containers, where more functions
are spread more thinly, including 3rd parties
There are
many metrics to monitor, but industry experience has shown that these 5: rate, errors, latency, saturation and utilization, contain virtually all the information you need to know what’s going on and where.
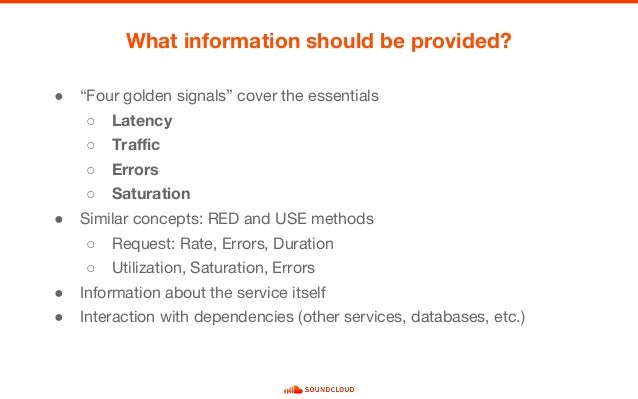
What are golden signals?
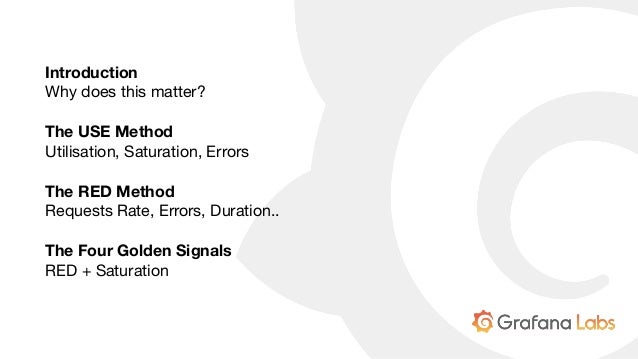
There is no definitive agreement, but these are the three main lists of golden signals today:
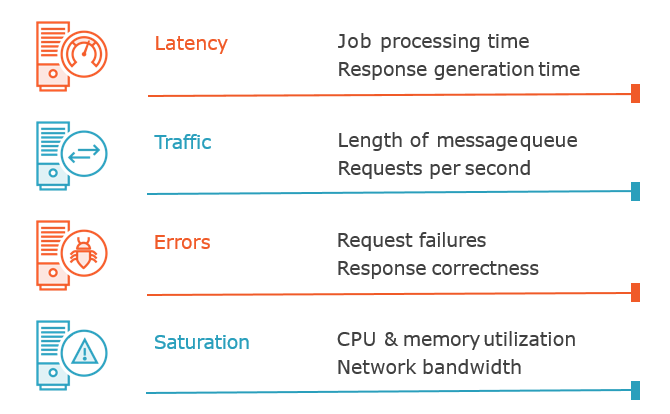
From the Google SRE book: Latency, Traffic, Errors, Saturation
USE Method (from Brendan Gregg): Utilization, Saturation, Errors
RED Method (from Tom Wilkie): Rate, Errors, and Duration
USE is about resources with an internal view, while RED is about requests and real work, with an external view.
Request Rate — request rate, in requests/sec.
Error Rate — error rate, in errors/sec.
Latency — response time, including queue/wait time, in milliseconds.
Saturation — how overloaded something is, directly measured by things like queue depth (or sometimes concurrency). Becomes non-zero when the system gets saturated.
Utilization — how busy the resource or system is. Usually expressed 0–100% and most useful for predictions (saturation is usually more useful for alerts).
One of the key reasons these are “golden” signals is they try to measure things that directly affect the end-user and work-producing parts of the system — they are direct measurements of things that matter.
This means they are more useful than less-direct measurements such as CPU, RAM, networks, replication lag, and endless other things.
We use the golden signals in several ways:
Alerting — tell us when something is wrong.
Troubleshooting — help us find and fix the problem.
Tuning & Capacity Planning — help us make things better
over time.
Are you average or percentile?
Basic alerts typically use average values to compare against some threshold, but - if your monitoring system can do it - use median values instead, which are less sensitive to big/small outlier values. This will reduce false alerts.
Percentiles are even better. For example, you can alert on 95th percentile latency, which is a much better measure of bad user experience
Furthermore, anomaly detection allows for tighter alerting bands so you can find issues much faster than you would with static thresholds (which must be fairly broad to avoid false alerts).
https://www.infoq.com/articles/monitoring-SRE-golden-signals
- First, what are the SRE Signals ?
There are three common lists or methodologies:
From the Google SRE book: Latency, Traffic, Errors, and Saturation
USE Method (from Brendan Gregg): Utilization, Saturation, and Errors
RED Method (from Tom Wilkie): Rate, Errors, and Duration
https://medium.com/devopslinks/how-to-monitor-the-sre-golden-signals-1391cadc7524
The RED Method defines the three key metrics you should measure for every
microservice in your architecture.
Those metrics are:
(Request) Rate - the number of
requests, per second, you services are serving.
(Request) Errors - the number of failed requests per second.
(Request) Duration - distributions of the
amount of time each request takes.
https://www.weave.works/blog/the-red-method-key-metrics-for-microservices-architecture/
- When ISPs bill "burstable" internet bandwidth, the 95th or 98th percentile usually cuts off the top 5% or 2% of bandwidth peaks in each month, and then bills at the nearest rate. In this way, infrequent peaks are ignored, and the customer is charged in a fairer way. The reason this statistic is so useful in measuring data throughput is that it gives a very accurate picture of the cost of the bandwidth. The 95th percentile says that 95% of the time, the usage is below this amount: so, the remaining 5% of the time, the usage is above that amount.
https://en.wikipedia.org/wiki/Percentile
- For example, if a score is at the 86th percentile, where 86 is the percentile rank, it is equal to the value below which 86% of the observations may be found. In contrast, if it is in the 86th percentile, the score is at or below the value of which 86% of the observations may be found. Every score is in the 100th percentile.
The 25th percentile is also known as the first quartile (Q1), the 50th percentile as the median or second quartile (Q2), and the 75th percentile as the third quartile (Q3). In general, percentiles and quartiles are specific types of quantiles.
https://pallipedia.org/percentile/#:~:text=A%20percentile%20(or%20a%20centile,the%20observations%20may%20be%20found.
- Monitor your applications by using the golden signals
Latency
Latency is the time that it takes to service a request, or the metric that is formally known as response time. It’s important to measure the latency from service to service and the latency that the user is experiencing. Establish a baseline for application normalcy with latency. It is a key indicator of degradation in the application.
Don't use averages against latency, as they can be misleading. Rather, use histograms for this metric. Establishing percentile thresholds and values provide a better understanding of what the latency is. Values in the 95th or 99th percentile are key to detecting performance issues in a request or a component.
Be sure to monitor the latency of errors, too. One bad long performing transaction can induce latency to the good requests, making for unhappy users.
Traffic
Traffic is the amount of activity in the application. This value might be different depending on the characteristics of the application. Again, don't use averages. Examples of traffic include the number of requests that an API handled, the number of connections to an application server, and the bandwidth that was consumed to stream an application.
Errors
Errors are the rate of requests that are failing. Monitoring explicit errors, such as HTTP 500s, is straightforward. You also need to "catch" the HTTP 200s that are sharing the wrong content. Measure errors in rates.
Errors should expose bugs in the application, misconfigurations in the service, and dependency failures. Error rates can also affect other measurements, such as lowering latency or increasing saturation.
Saturation
Saturation is how "full" your service is. The type of application that you're monitoring is directly related to the utilization metrics that you use to determine saturation. Saturation is the most challenging signal to implement. You need utilization metrics and the utmost flexibility to determine saturation.
A few examples for determining saturation are as follows:
CPU and memory for all applications
Disk I/O rates for databases and streaming applications
Heap, memory, thread pool garbage collection for Java™ applications
99th percentile for latency
Keep in mind that the application services usually start to degrade before a metric reaches 100% utilization.
It takes time to set up the signals for all the components in today’s applications. The easiest path is to shift left and begin monitoring and testing the application during the development and load-test phases, understanding the performance characteristics before the production rollout.
The successful implementation of the golden signals is key to achieving observability. Apply the signals to these activities:
Monitoring application runtimes
Monitoring the user experience
Synthetic or black-box monitoring
Creating useful dashboards that provide information about the monitored component
Collect and store metric data to support query capabilities and establish performance normalcy and trending for the monitored service. You can also use metric data to explore hypotheses and institute AIops capabilities. Metric data can provide searchable and extensible data dimensions and be a robust data source for dashboards. Dashboards are no longer static and require slice-and-dice capabilities of the data to investigate an incident or improve the application's performance or scalability.
Send actionable alerts. Make sure that alerts require intervention by a first responder and that they contain valuable context as to what is going on.
https://www.ibm.com/garage/method/practices/manage/golden-signals/
Monitoring based on metrics exposed by the internals of the system, including logs, interfaces like the Java Virtual Machine Profiling Interface, or an HTTP handler that emits internal statistics.
Black-box monitoring
Testing externally visible behavior as a user would see it.
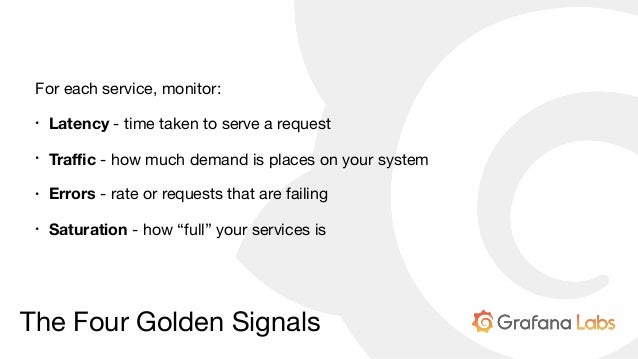
The Four Golden Signals
Latency
The time
it takes to service a request. It’s important to distinguish between the latency of successful requests and the latency of failed requests. For example, an HTTP 500 error triggered
due to loss of connection to a database or other critical backend might
be served very quickly;
however, as an HTTP 500 error
indicates a failed request, factoring 500s into your overall latency might
result in misleading calculations.
On the other hand, a slow error is even worse than a fast error! Therefore, it’s important to track error latency, as opposed to just filtering out errors.
Traffic
A measure of how much demand is being placed on your system, measured in a high-level system-specific metric. For a web service, this measurement is usually HTTP requests per second, perhaps broken out by
the nature of the requests (e.g., static versus dynamic content). For an audio streaming system, this measurement might focus on network I/O rate or concurrent sessions. For a key-value storage system, this measurement might be transactions and retrievals per second
Errors
The rate of requests that fail, either explicitly (e.g., HTTP 500s), implicitly (for example, an HTTP 200 success response, but coupled with the wrong content), or by policy (for example, "If you committed to one-second response times, any request over one second is an error"). Where protocol response codes
are insufficient to express all failure conditions, secondary (internal) protocols may be necessary to track partial failure modes. Monitoring these cases can be drastically different: catching HTTP 500s at your load balancer can do a decent job of catching all
completely failed requests, while only end-to-end system tests can detect that you’re serving the wrong content.
Saturation
How "full" your service is. A measure of your system fraction, emphasizing the resources that are most constrained (e.g., in a memory-constrained system, show memory; in
an I/O-constrained system, show I/O). Note that many systems degrade in performance before they achieve 100% utilization, so having
a utilization target is essential.
In complex systems,
saturation can be supplemented with higher-level load measurement: can your service properly handle double the traffic, handle only 10% more traffic, or handle even less traffic than it
currently receives? For
very simple services that have no parameters that alter the complexity of the request (e.g., "Give me a nonce" or "I need a globally unique monotonic integer") that rarely change configuration, a static value from a load test might be adequate. As discussed in the previous paragraph, however, most services need to use indirect signals like CPU utilization or network bandwidth that have a known upper bound. Latency increases are often a leading indicator of saturation. Measuring your 99th percentile response time over some small window (e.g., one minute) can give a very early signal of saturation.
https://landing.google.com/sre/sre-book/chapters/monitoring-distributed-systems/
- Metrictank is a multi-tenant timeseries engine for Graphite and friends. It provides long term storage, high availability, efficient storage, retrieval and processing for large scale environments.
https://github.com/grafana/metrictank
- Announcing the first step in our journey to create a new and modern Graphite-compatible stack for large environments: metrictank. A high performance replacement for carbon and whisper.
Graphite Compatible
metrictank is fully compatible and works seamlessly with all your existing tools and dashboards.
metrictank uses the proven, rock-solid Cassandra for highly reliable clustered storage that works at
massive scale.
http://milo.wearecapacity.com/metrictank/
- Metrictank publishes its own internal stats to a graphite-compatible datastore (such as graphite/carbon or metrictank itself). This dashboard queries that databasource.
https://grafana.com/dashboards/279
- Graylog is a powerful open-source log management platform. It aggregates and extracts important data from server logs, which are often sent using the Syslog protocol. It also allows you to search and visualize the logs in a web interface.
https://www.digitalocean.com/community/tutorials/how-to-manage-logs-with-graylog-2-on-ubuntu-16-04
How to Use
Graylog for Software Monitoring
Graylog, an open-source solution for log management. We usually have it paired up with
Grafana, an open-source dashboard for data visualization.
Graylog is a powerful platform that allows for easy log management of both structured and unstructured data along with debugging applications.
It is based on Elasticsearch, MongoDB, and Scala.
We use
Graylog primarily as the stash for the logs of the web applications we build.
However, it is also effective when working with raw strings (i.e.
syslog): the tool parses it into the structured data we need.
In other words, when integrated properly with a web app,
Graylog helps engineers to analyze the system behavior on almost per code line basis
The main advantage of
Graylog is that it provides a perfect single instance of log collection for the whole system.
At
Logicify, we use
Graylog both for the applications under development and the ones already released publicly.
As
Graylog consistently stores all the logs of an application, it allows tracking of the system’s state for every specific moment of time. This gives developers an efficient mechanism to understand the context of any error
Use in the Production Phase
In software products that
are already released for public use,
Graylog is also applied for log storage.
https://dzone.com/articles/how-to-use-graylog-for-technical-monitoring-in-sof
- Advantages of Graylog+Grafana Compared to ELK Stack
Graylog has proved effective and user-friendly for log storage and management
The tool has a powerful search syntax, so it is easy to find exactly what you are looking for, even if you have terabytes of log data.
The search queries could be saved.
Graylog offers an archiving functionality, so
everything older than 30 days could be stored on slow storage and re-imported into
Graylog when such a need appears (for example, when the dev team need to investigate a certain event from the past)
Python applications could be easily connected with
Graylog as there is an out-of-box library for this.
Graylog server (the entire application and web interface), combined with MongoDB and Elasticsearch,
is often compared to the ELK stack (Elasticsearch, Logstash, and Kibana).
Graylog is positioned as a powerful logging solution, while ELK is a Big Data solution
Graylog can receive structured logs and standard
syslog directly from an application through the network protocol.
On the contrary, ELK is the solution that analyzes already collected plain text logs using Logstash and then parses them to
ElasticSearch
Graylog in this sense is more convenient as it offers a single-application solution (excluding
ElasticSearch as a flexible data storage) with almost the same functionality. So the time needed to deploy a usable solution is shorter.
https://medium.com/@logicify/advantages-of-graylog-grafana-compared-to-elk-stack-a7c86d58bc2c
- Comparing network monitoring tools; Nagios ,Cricket ,Cacti ,Zenoss ,Zabbix
I used tools that fellow administrators will find familiar: Nagios and Cacti. And another less famous text-configuration-based monitoring tool called Cricket. That worked well somehow but Cricket was hard to learn for my coworkers and Cacti seems unreliable and
fundamentally broken in terms of SNMP checking. Besides why do I have to set up availability checking in Nagios and set up checking of the same parameters in another software to draw graphs? Then in 2009 I came across an open-source software I hadn't heard of before:
Zabbix. And although it has a few rough
edges it seems way more professional than other common tools (the commercial tools I saw were even worse than the open-source variants). I tried it and after a lot of reading and trying it looks like it has a good potential to replace Nagios and Cacti workaround
.org/try-
zabbix
- Grafana vs. Kibana: The Key Differences to Know
Both Kibana and
Grafana are powerful visualization tools. However, at their core, they are both used for different data types and use cases
Grafana together with a time-series database such as Graphite or InfluxDB is a combination used for metrics analysis
Kibana is part of the popular ELK Stack, used for exploring log data
a significant amount of organizations will use both tools as part of their overall monitoring stack. At Logz
.io we use both tools to monitor our production environment, with
Grafana hooked up to Graphite, Prometheus and Elasticsearch.
https://
logz.io/blog/grafana-vs-kibana/
- Log Management Comparison: ELK vs Graylog
Logging with ELK
ELK is an acronym for 3 open-source projects
– ElasticSearch, Logstash, and Kibana.
ElasticSearch – stores large amounts of data and lets you search it
Logstash
– processes the data
Kibana
– a GUI that lets you visualize large amounts of data
Pros:
Robust solution
Variety of plugins
Logstash allows you to create customized log processing pipeline
Incredible Kibana visualizations
Control over how you index data in
ElasticSearch
Cons:
Steep learning curve
Kibana has no default “logging” dashboards
Requires intensive management
Authentication and Alerting are paid features
Logging with
Graylog
If you want to add to its functionality, you will
likely have to add other tools like
Grafana for intricate graphs, an InfluxDB or Graphite
datastore or other custom scripts and programs
Pros:
Quick setup
Authentication and Authorization included for free
Parsing, alerting, some basic graphing
Small learning curve
Mostly GUI-based
Cons:
Limited scope of what it does well
Powerful parsing ability
Graphing is basic
– will need to use
Grafana and/or Kibana
Fewer plugins available than for Logstash and Kibana
DevOps engineers and CTOs mostly care about speed, reliability, and flexibility in queries and visualizations. For this, the ELK stack is a better choice.
If alerting is important to you,
Graylog is your best option.
Graylog is also the better choice for security logs collection, while the ELK stack has can be
a bit more difficult to implement
for that matter.
https://coralogix.com/log-analytics-blog/log-management-comparison-elk-vs-graylog/
- Best of 2018: Log Monitoring and Analysis: Comparing ELK, Splunk and Graylog
Elasticsearch is a modern search and analytics engine based on Apache Lucene, while Logstash provides data processing and enrichment. Kibana offers logs discovery and visualization.
Splunk is a platform for searching, analyzing and visualizing the machine-generated data gathered from the websites, applications, sensors, devices etc. covering the entire infrastructure landscape.
It communicates with different log files and stores files data in the form of events into local indexes. It provides the easiest way of search capabilities and has
wide array of options to collect logs from multiple sources.
Graylog offers open source log monitoring tools providing capabilities similar to ELK and Splunk.
Graylog performs centralized log monitoring; where
Graylog is used for data processing and Elasticsearch, MongoDB used for search and storage. It provides log archival and drill-down of metrics and measurements.
https://devops.com/log-monitoring-and-analysis-comparing-elk-splunk-and-graylog/
API Monitoring Fundamentals
UPTIME MONITORING
Be the first to know when an API is down.
PERFORMANCE MEASUREMENT
Get visibility into API performance
DATA VALIDATION
Ensure that the structure and content of your API calls are returning the data
that you—and your customers
Five Steps to API Monitoring Success
1-Run API monitors frequently
2-Validate response data
Add assertions to your API monitors to make sure your APIs are returning the right data.
3-Cover functional use cases
4-Include integrations with third-party & partner APIs
5-Get a complete performance picture
https://www.runscope.com/api-monitoring
- Request tracing is the ultimate insight tool. Request tracing tracks operations inside and across different systems. Practically speaking, this allows engineers to see the how long an operation took in a web server, database, application code, or entirely different systems, all presented along a timeline. Request tracing is especially valuable in distributed systems where a single transaction (such as “create an account”) spans multiple systems.
Request tracing complements logs and metrics. A trace tells you when
one of your flows is broken or slow along with the latency of each step. However, traces don’t explain latency or errors. Logs can explain why. Metrics allow
deeper analysis into system faults. Traces are also specific to a single operation,
they are not aggregated like logs or metrics. Tracing, logs, and metrics form the ultimate telemetry solution. Teams armed with all three
are well equipped to debug and resolve production problems.
Zipkin and Jaeger are two popular choices for request tracing.
Zipkin was originally inspired by Dapper and developed by Twitter.
Jaeger
was originally built and open sourced by Uber. Jaeger is a Cloud Native Computing Foundation project.
https://
logz.io/blog/zipkin-vs-jaeger/
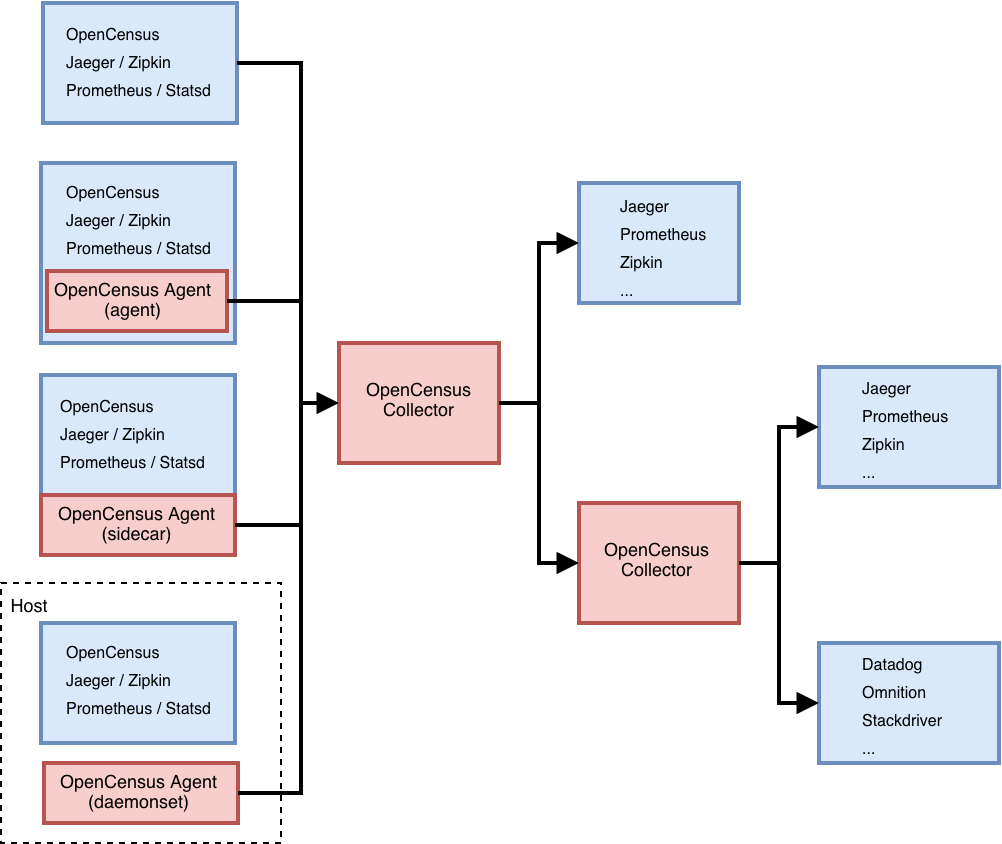
OpenCensus and OpenTracing have merged to form
OpenTelemetry, which serves as the next major version of
OpenCensus and OpenTracing.
OpenTelemetry is made up of an integrated set of APIs and libraries
as well as a collection mechanism via an agent and collector. These components are used to generate, collect, and describe telemetry about distributed systems. This data includes basic context propagation, distributed traces, metrics, and other signals
in the future.
OpenTelemetry is designed to make it easy to get critical telemetry data out of your services and into your backend
(s) of choice. For each supported language it offers a single set of APIs, libraries, and data specifications, and developers can take advantage of whichever components they see fit.
OpenTelemetry is a CNCF incubating project.
Formed through a merger of the OpenTracing and OpenCensus projects.
https://opentelemetry.io/
- Telemetry is the in situ collection of measurements or other data at remote points and their automatic transmission to receiving equipment (telecommunication) for monitoring
Although the term commonly refers to wireless data transfer mechanisms (e.g., using radio, ultrasonic, or infrared systems), it also encompasses data transferred over other media such as a telephone or computer network, optical link or other wired communications like power line carriers. Many modern telemetry systems take advantage of the low cost and ubiquity of GSM networks by using SMS to receive and transmit telemetry data.
A telemeter is a physical device used in telemetry. It consists of a sensor, a transmission path, and a display, recording, or control device. Electronic devices are widely used in telemetry and can be wireless or hard-wired, analog or digital. Other technologies are also possible, such as mechanical, hydraulic and optical
Telemetry may be commutated to allow the transmission of multiple data streams in a fixed frame.
https://en.wikipedia.org/wiki/Telemetry
New Relic Is All In On The Future of Observability
https://blog.newrelic.com/product-news/observability-open-instrumentation-opentelemetry/
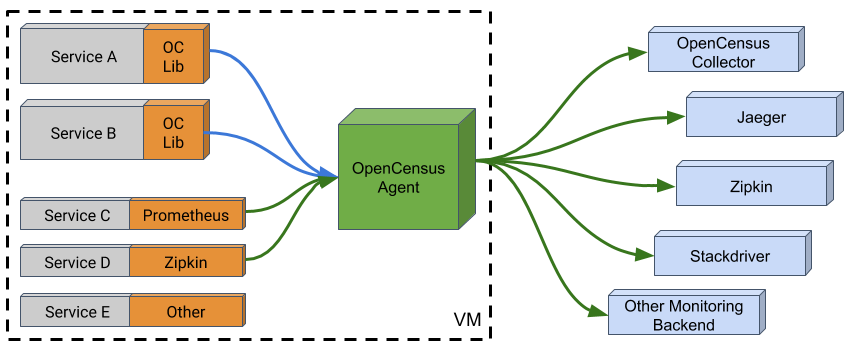
OpenCensus is a set of libraries for various languages that allow you to collect application metrics and distributed traces, then transfer the data to a backend of your choice in real time.
This data can be analyzed by developers and admins to understand the health of the application and debug problems.
https://opencensus.io/
OpenCensus: A Stats Collection and Distributed Tracing Framework
https://opensource.googleblog.com/2018/01/opencensus.html
- Centreon - IT and Application monitoring software
Centreon is a network, system, applicative supervision and monitoring tool
https://github.com/centreon/centreon
- IPERF: How to test network Speed,Performance,Bandwidth
Network Throughput
Transfer rate of data from one place to another with respect to time is called as
throughput.
Throughput is considered a quality measuring metric for hard
disks,network etc.
Its measured in
Kbps(Kilo bits per second)
,Mbps(Mega bits per second)
,Gbps(Giga bits per second.)
TCP Window
TCP (Transmission Control Protocol), is a reliable transport layer protocol used for network communications
Whenever two
machine's are communicating with each other, then each of them will inform the other, about the amount of bytes it is ready to receive at one time.
In other words, the maximum amount of data that a sender can send the other end, without an acknowledgement is called as Window Size. This TCP window size affects network
throughput very badly sometimes
Suppose you want to send a 500MB of data from one machine to the other, with the tcp window size of 64KB.
Which means for sending the whole 500MB data, the sending machine has to wait 800 times for an acknowledgement from the receiver.
500MB / 64KB = 800
So you can
clearly see that, if you increase the Window size a
little bit to tune TCP, it can bring
significant difference to the throughput achieved
As we discussed before, not only TCP window size but network parameter's like the following also affects the throughput achieved during a
connectionn.
Out of order delivery
Network Jitter
Packet loss out of total number of packets
Network jitter = 0.167 ms (network jitter is the deviation in time for periodic arrival of data gram's. If you are doing the test with server's on the other side of the globe, then you might see higher jitter values in
iperf output.)
https://www.slashroot.in/iperf-how-test-network-speedperformancebandwidth
- What is Docker Monitoring?
However, the use of containers to build application environments has a disruptive impact on traditional monitoring methods because containers don’t fit well with the assumptions made by traditional tools and methods that
were originally designed for bare-metal machines.
Common challenges
The
dynamicity of container based application infrastructure brings new problems
to monitoring tools. Also, Docker added another layer of infrastructure and network monitoring requirements to the overall scope.
Think of the typical scenario of multiple VMs provisioned on a bare-metal machine and containers come and go on each one of those VMs. The monitoring requirements include checking the health of bare-metal host, the VMs provisioned on it and the containers active at a
given point of time.
Of course, how well these components are interacting with each other and to the outer world should also
be checked from the networking side of monitoring requirements.
Monitor Docker host
Docker containers are run on a cluster of
large bare-metal or virtual machines. Monitoring of these machines for their availability and performance is important. This falls into the traditional infrastructure monitoring.
Tracking containers
The Docker containers are run on a cluster of hosts and a specific Docker instance could
be running on any
one of those hosts depending on the scheduling and scaling strategies set in the container orchestration system used like Docker Swarm,
Kubernetes, Apache
Mesos and
Hashicorp Nomad.
Ideally, there is no need to track where the containers are running but things are not ideal usually in production (and that’s why you need monitoring in the first place) and
you may want to look at a specific container instance. Tracking information on the up and running containers would be handy in such situations and also to make sure that scheduling and scaling rules
are actually enforced.
Runtime resource usage
As with bare-metal and virtual machines, CPU, memory and storage metrics
are tracked for Docker containers
as well.
The native Docker command “docker stats” returns some of these metrics
Container networking
Checking on container level networks is one of the most important aspect of Docker monitoring
Tracking ephemeral containers
The containers come and go and it would be better if those
are not tracked individually. The best method is to tag the containers with keywords. That way
time series data from same type of containers could be looked up for monitoring and operational insights, irrespective of their
lifecycle status.
Application endpoints
A container-based environment would
be running a large, highly distributed application with each service running on one or more containers.
The application checks could be done both at the container level, pod level and system-wide level. (A pod is a group of containers that offers a service.) Usually REST API endpoints would be available to perform such checks that could easily
be plugged into any modern monitoring system to check the availability of related services.
Most of the popular monitoring tools are not equipped to monitor Docker containers though it is
not hard to extend them to support containers.
https://www.bmc.com/blogs/docker-monitoring-explained-monitor-containers-microservices/
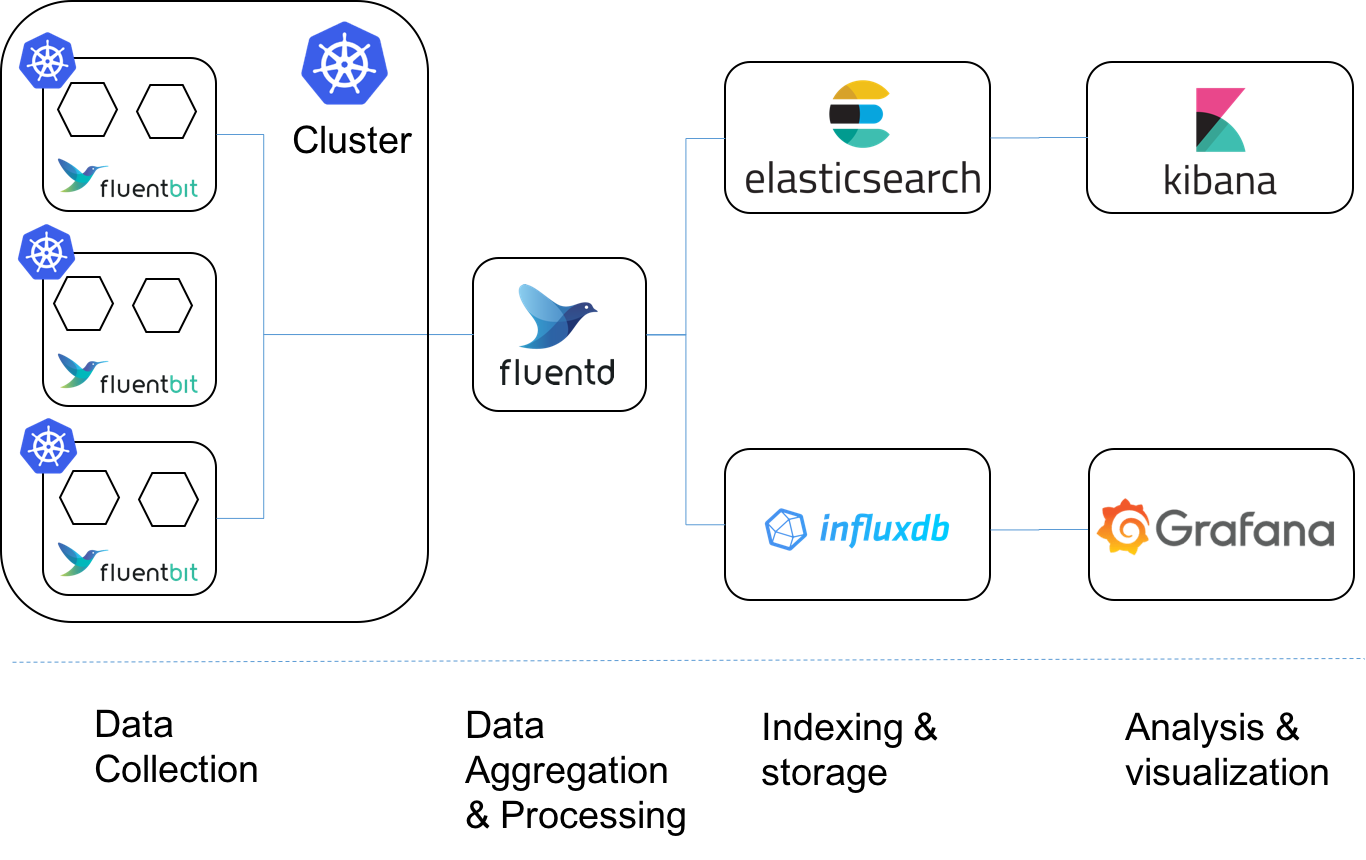
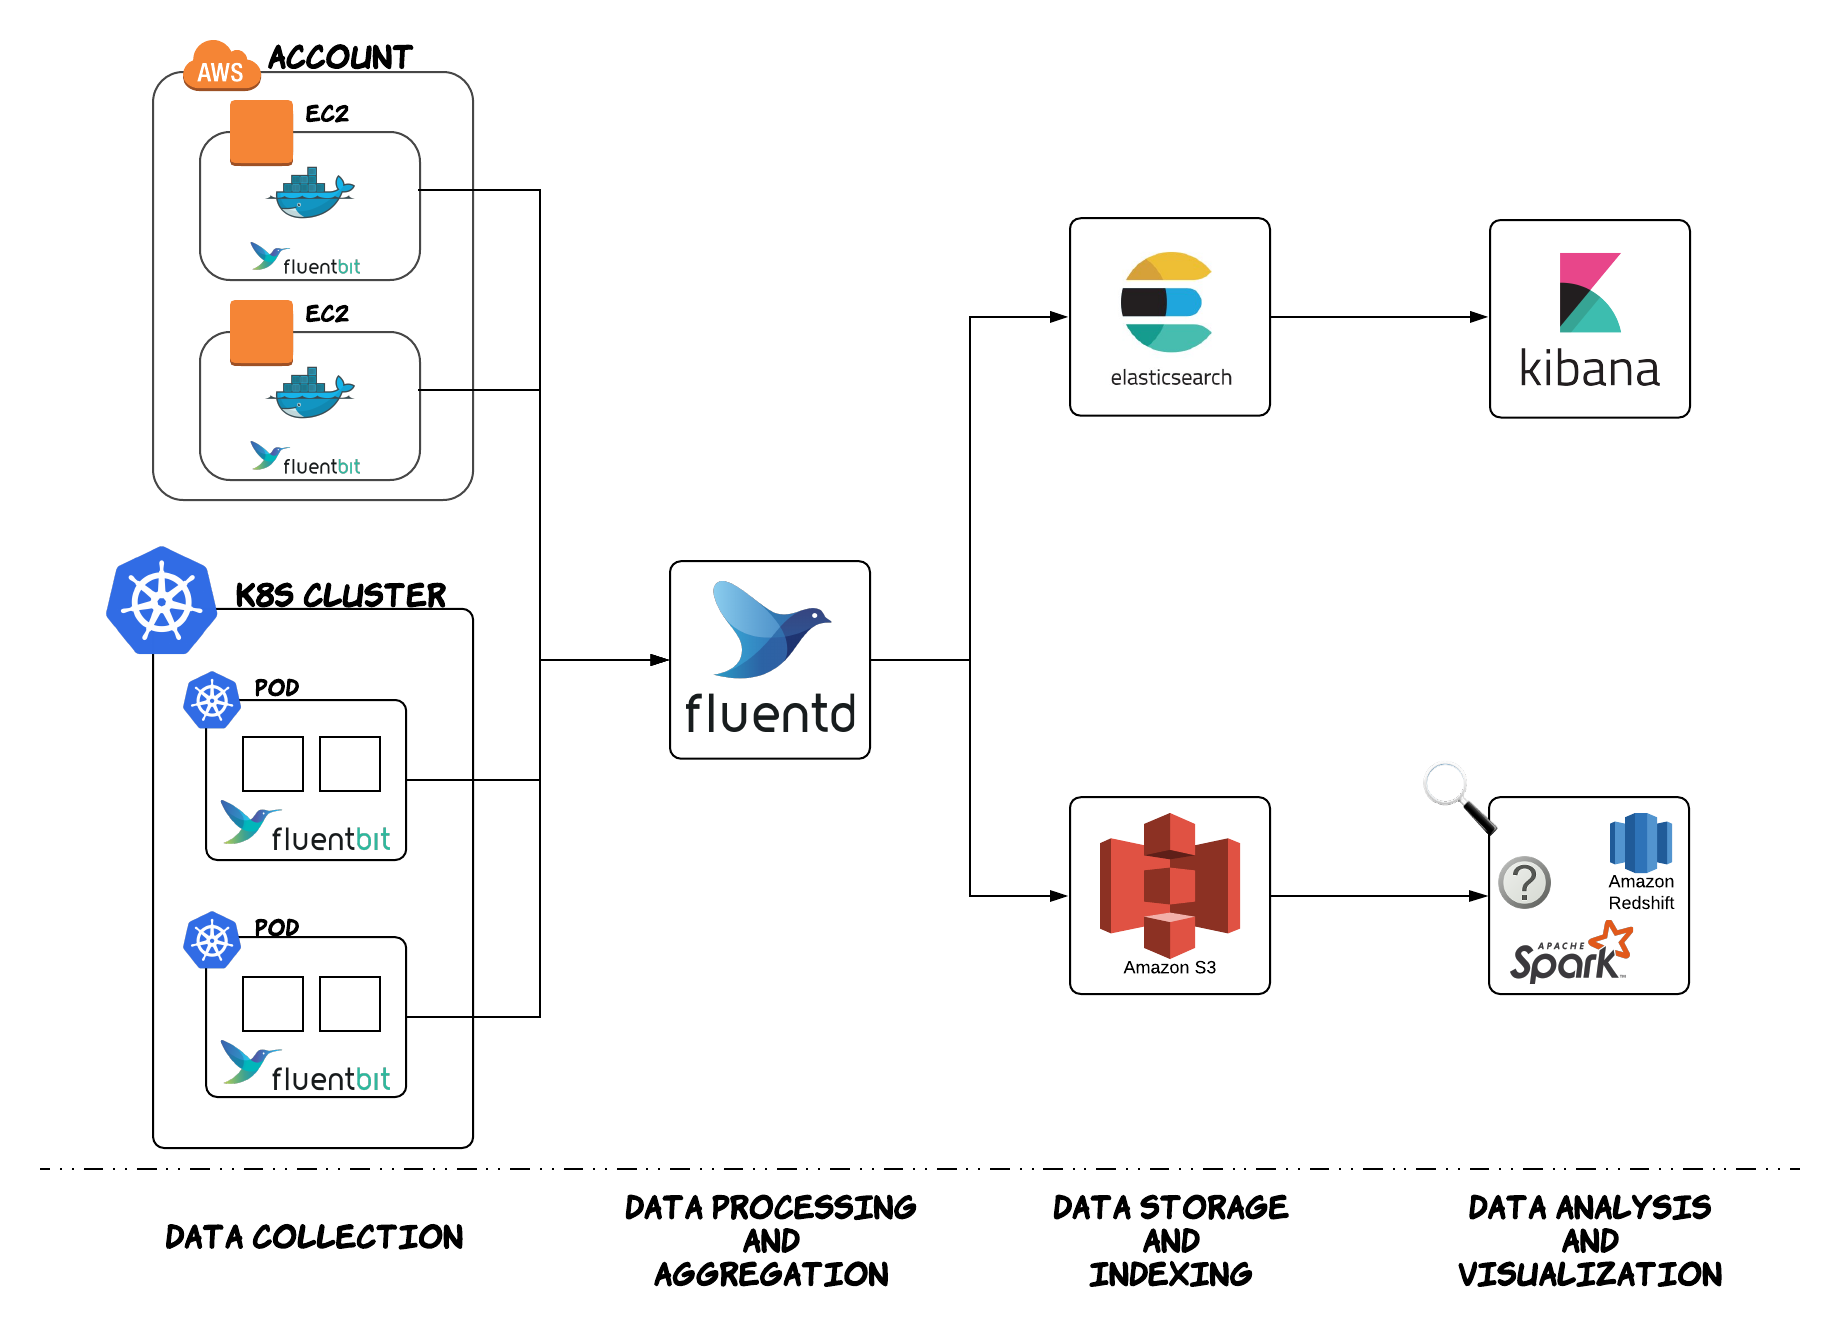
- Kubernetes Logging: Comparing Fluentd vs. Logstash
Logging is an important part of the observability and operations requirements for any large-scale, distributed system.
There are multiple log aggregators and analysis tools in the DevOps space, but two dominate Kubernetes logging: Fluentd and Logstash from the ELK stack.
Both log aggregators, Fluentd and Logstash, address the same DevOps functionalities but are different in their approach, making one preferable to the other, depending on your use case.
Fluentd and Logstash are log collectors.
Logstash
Elasticsearch is the distributed, search engine.
With Kibana, users can create powerful visualizations of their data, share dashboards, and manage the Elastic Stack
Logstash is the ELK open-source data collection engine and it can do real-time pipelining
Logstash can unify data from disparate sources dynamically and also normalize the data into destinations of your choice
Fluentd
lets you unify the data collection and consumption to allow better insight into your data.
Fluentd scraps logs from a given set of sources, processes them (converting into a structured data format) and then forwards them to other services like Elasticsearch, object storage etc.
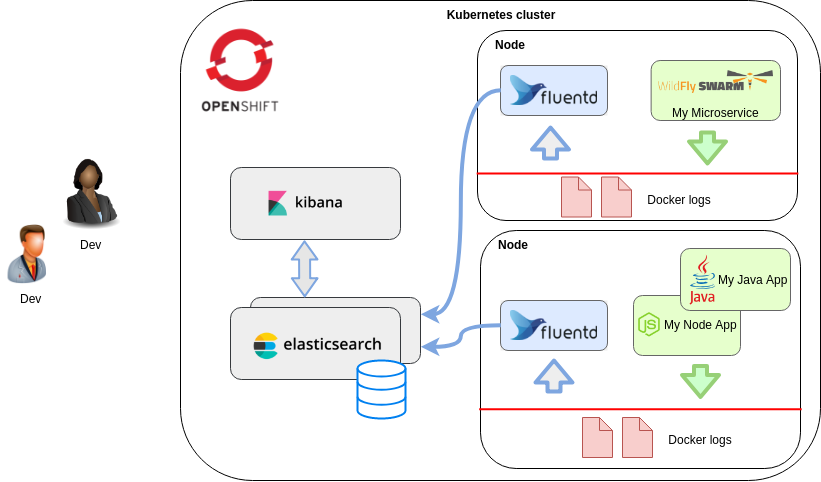
Fluentd also works together with ElasticSearch and Kibana. This is known as the EFK stack.
Comparing Logstash and Fluentd
Both tools run on both Windows and Linux
Event routing
Logstash and Fluentd are different in their approach concerning event routing.
Logstash uses the if-else condition approach; this way we can define certain criteria with If..Then..Else statements – for performing actions on our data.
With Fluentd, the events are routed on tags. Fluentd uses tag-based routing and every input (source) needs to be tagged. Fluentd then matches a tag against different outputs and then sends the event to the corresponding output.
Transport
Logstash is limited to an in-memory queue that holds 20 events and, therefore, relies on an external queue, like Redis, for persistence across restart.Often, Redis is facilitated as a “broker” in a centralized Logstash installation, queueing Logstash events from remote Logstash “shippers”.
This means that with Logstash you need an additional tool to be installed and configured in order to get data into Logstash.
This dependency on an additional tool adds another dependency and complexity to the system, and can increase the risk of failure
with Fluentd, which is independent in getting its data and has a configurable in-memory or on-disk buffering system. Fluentd, therefore, is ‘safer’ than Logstash regarding data transport.
Performance and high-volume logging
it is known that Logstash consumes more memory than Fluentd.
Elastic Beats and Fluent-bit that have an even smaller resource footprint.
Fluentd uses Ruby and Ruby Gems for configuring its 500+ plugins
Fluent-bit is recommended when using small or embedded applications.
Elastic beats is the lightweight variant of Logstash. However, if your use case goes beyond mere data transport, to also require data pulling and aggregation, then you’d need both Logstash and Elastic Beats.
Log parsing
Fluentd uses standard built-in parsers (JSON, regex, csv etc.) and Logstash uses plugins for this
Docker support
Docker has a built-in logging driver for Fluentd, but doesn’t have one for Logstash. With Fluentd, no extra agent is required on the container in order to push logs to Fluentd. Logs are directly shipped to Fluentd service from STDOUT without requiring an extra log file.
Logstash requires a plugin (filebeat) in order to read the application logs from STDOUT before they can be sent to Logstash.
when using Docker containers, Fluentd is the preferred candidate, as it makes the architecture less complex and this makes it less risky for logging mistakes.
Container metrics data collection
Both Fluentd and Logstash use the Prometheus exporter to collect container metrics
Logstash, as part of the ELK stack, also uses MetricBeat.
Coding
Logstash can be coded with JRuby and Fluentd with CRuby. This means Fluentd has an advantage here, because no java runtime is required.
Logstash vs. Fluentd: Which one to use for Kubernetes?
Data logging can be divided into two areas: event and error logging. Both Fluentd and Logstash can handle both logging types and can be used for different use cases, and even co-exist in your environments for logging both VMs/legacy applications as well as Kubernetes-based microservices
For Kubernetes environments, Fluentd seems the ideal candidate due to its built-in Docker logging driver and parser – which doesn’t require an extra agent to be present on the container to push logs to Fluentd. In comparison with Logstash, this makes the architecture less complex and also makes it less risky for logging mistakes. The fact that Fluentd, like Kubernetes, is another CNCF project
https://platform9.com/blog/kubernetes-logging-comparing-fluentd-vs-logstash/
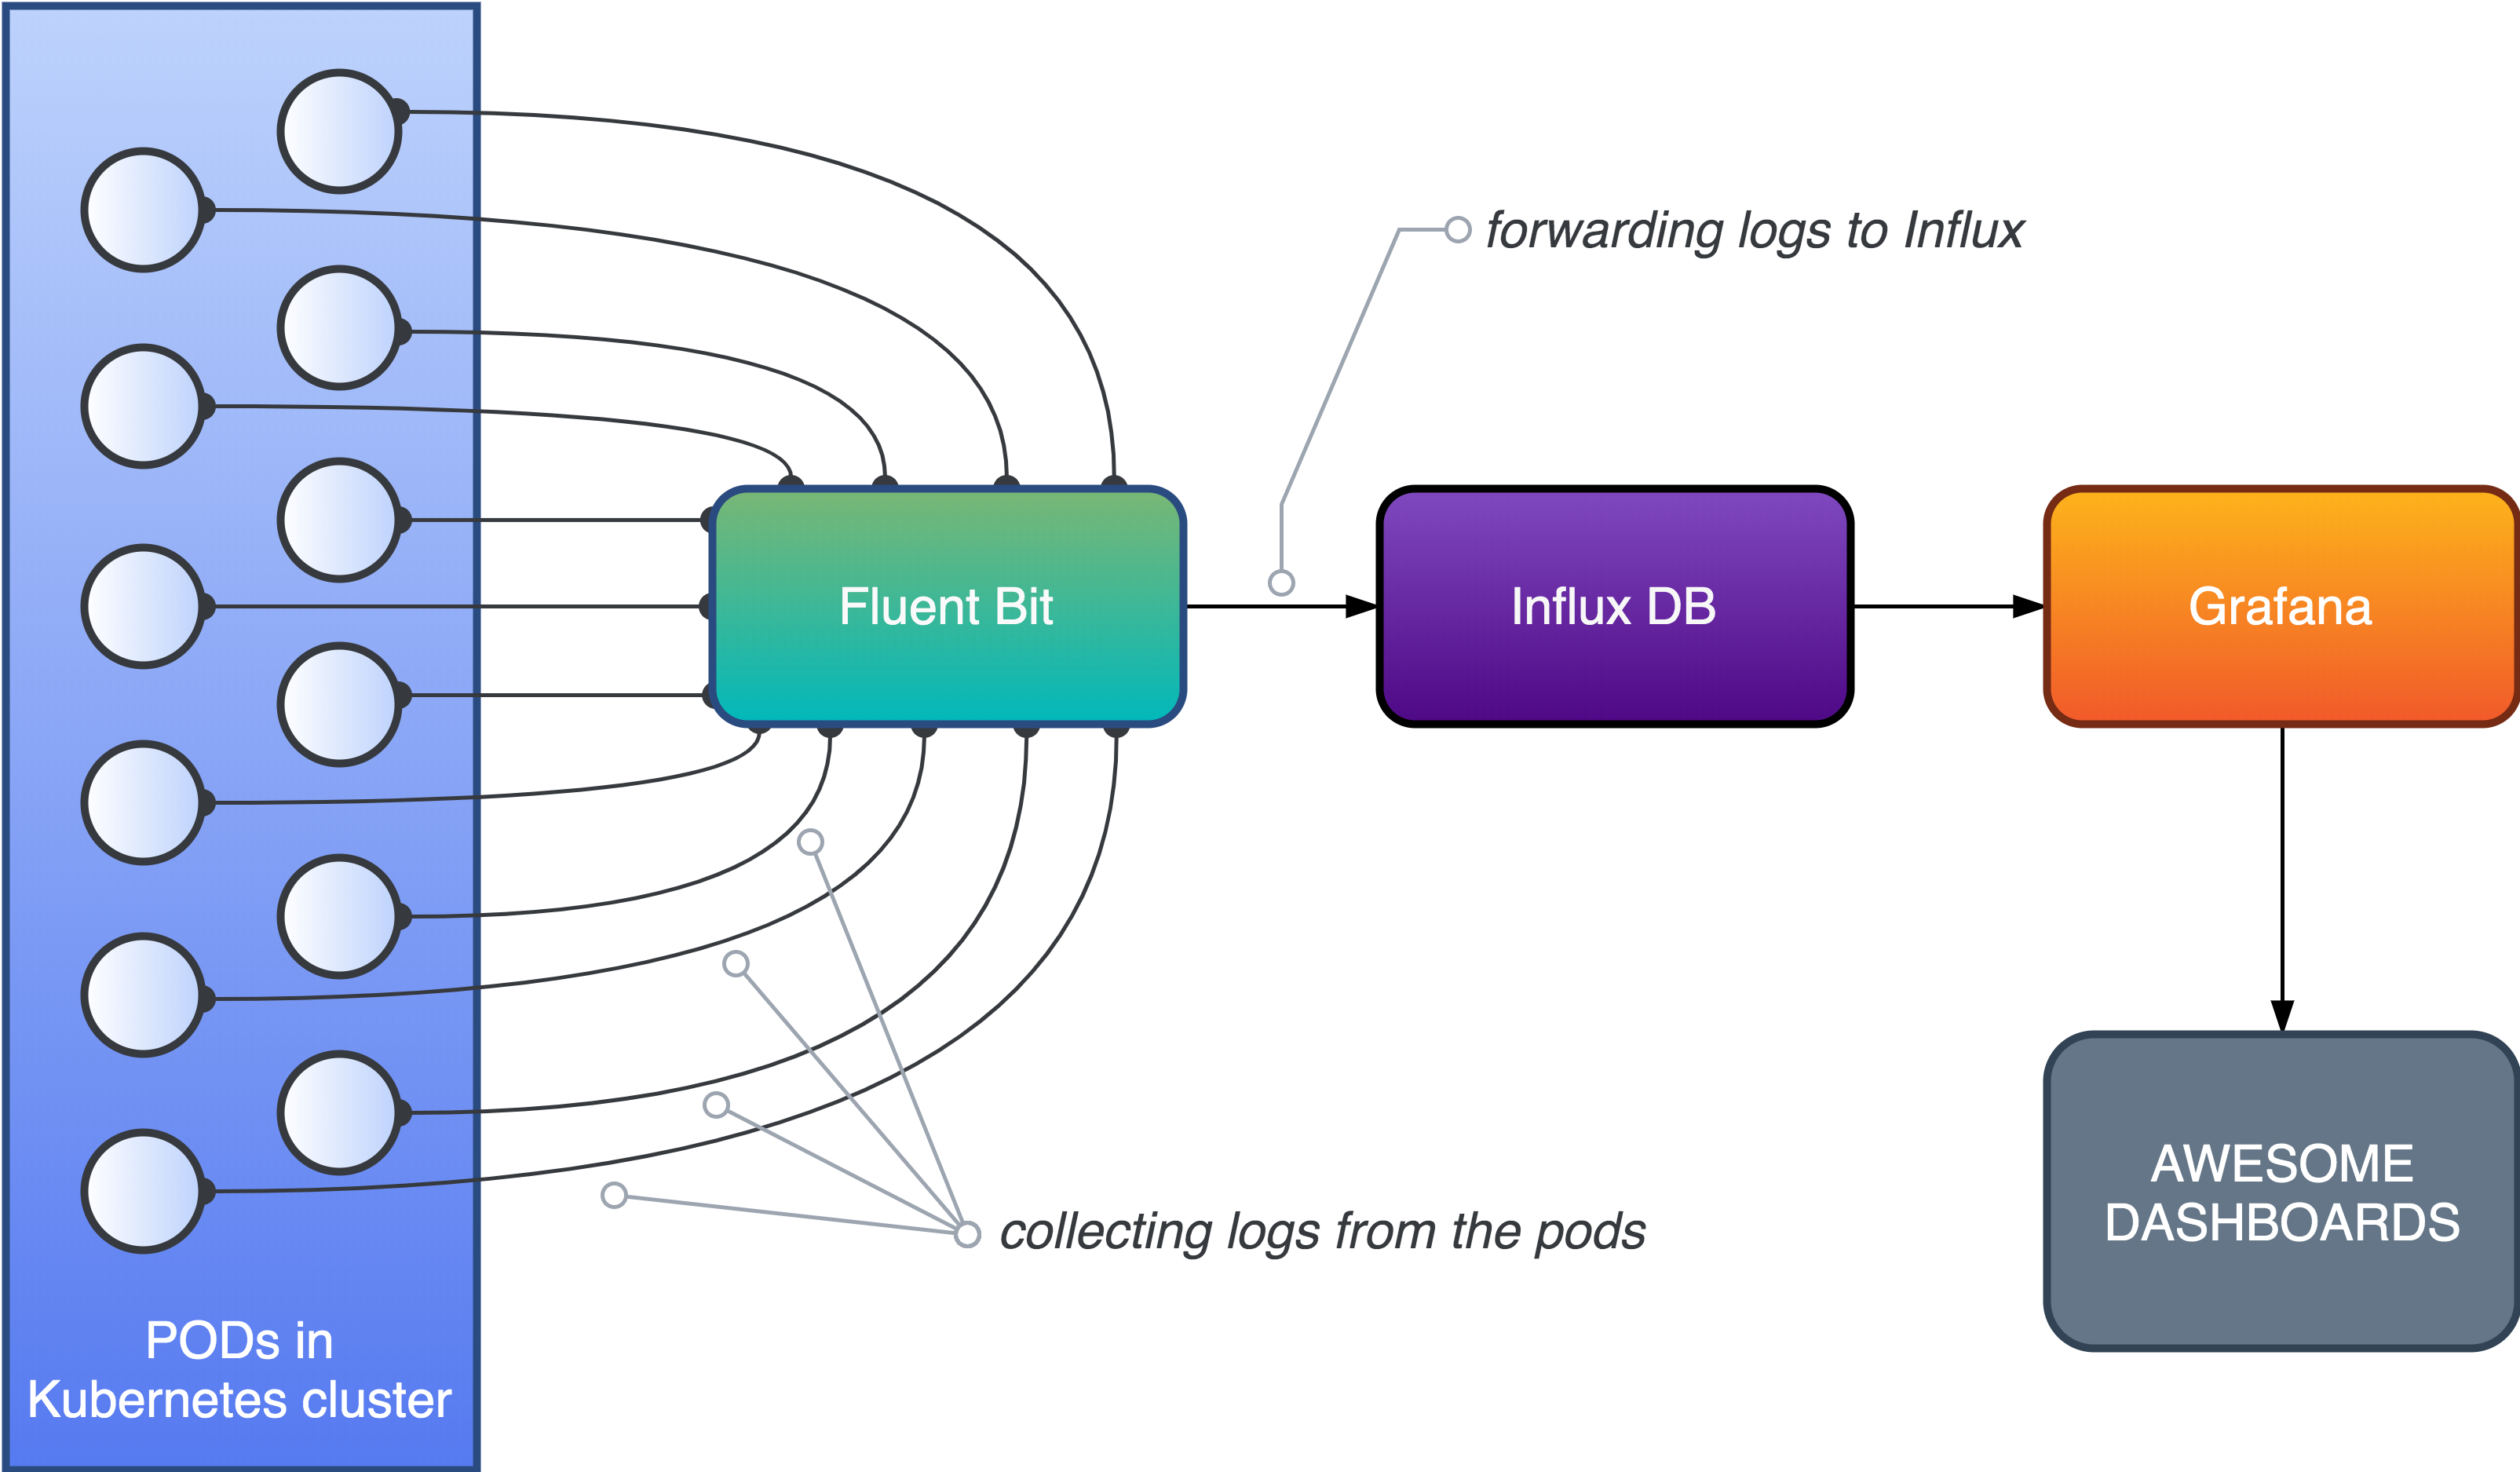
- Fluent Bit is an open source and multi-platform Log Processor and Forwarder which allows you to collect data/logs from different sources, unify and send them to multiple destinations. It's fully compatible with Docker and Kubernetes environments.
https://fluentbit.io/
- Beats is a free and open platform for single-purpose data shippers. They send data from hundreds or thousands of machines and systems to Logstash or Elasticsearch.
https://www.elastic.co/beats/
- Fluentd vs Logstash: Platform Comparison
Logstash: Linux and Windows
Fluentd: Linux and Windows
Event Routing Comparison
Logstash Event Routing
Logstash routes all data into a single stream and then uses algorithmic if-then statements to send them to the right destination.
Fluentd Event Routing
Fluentd relies on tags to route events. Each Fluentd event has a tag that tells Fluentd where it wants to be routed.
Fluentd’s approach is more declarative whereas Logstash’s method is procedural.
Logstash: Uses algorithmic statements to route events and is good for procedural programmers
Fluentd: Uses tags to route events and is better at complex routing
Plugin Ecosystem Comparison
Logstash Plugins
One key difference is how plugins are managed. Logstash manages all its plugins under a single GitHub repo
Fluentd Plugins
Fluentd adopts a more decentralized approach.
Transport Comparison
Logstash lacks a persistent internal message queue: Currently, Logstash has an on-memory queue that holds 20 events (fixed size) and relies on an external queue like Redis for persistence across restarts.
aim to persist the queue on-disk.
Fluentd has a highly easy-to-configure buffering system. It can be either in-memory or on-disk with more parameters
The upside of Logstash’s approach is simplicity: the mental model for its sized queue is very simple. However, you must deploy Redis alongside Logstash for improved reliability in production.
Logstash: Needs to be deployed with Redis to ensure reliability
Fluentd: Built-in reliability, but its configuration is more complicated
Performance Comparison
Logstash is known to consume more memory at around 120MB compared to Fluentd’s 40MB.
Spread across 1,000 servers, this can mean 80GB of additional memory use, which is significant. (This hypothetical number comes from the 80MB difference between Logstash and FluentD on a single machine multiplied by 1,000 machines.)
Logstash has a solution. Instead of running the fully featured Logstash on leaf nodes, Elastic recommends that you run Elastic Beats, resource-efficient, purpose-built log shippers.
On Fluentd’s end, there is Fluent Bit, an embeddable low-footprint version of Fluentd written in C, as well as Fluentd Forwarder, a stripped down version of Fluentd written in Go
Logstash: Slightly more memory use. Use Elastic Beats for leaf machines.
Fluentd: Slightly less memory use. Use Fluent Bit and Fluentd Forwarder for leaf machines.
https://logz.io/blog/fluentd-logstash/

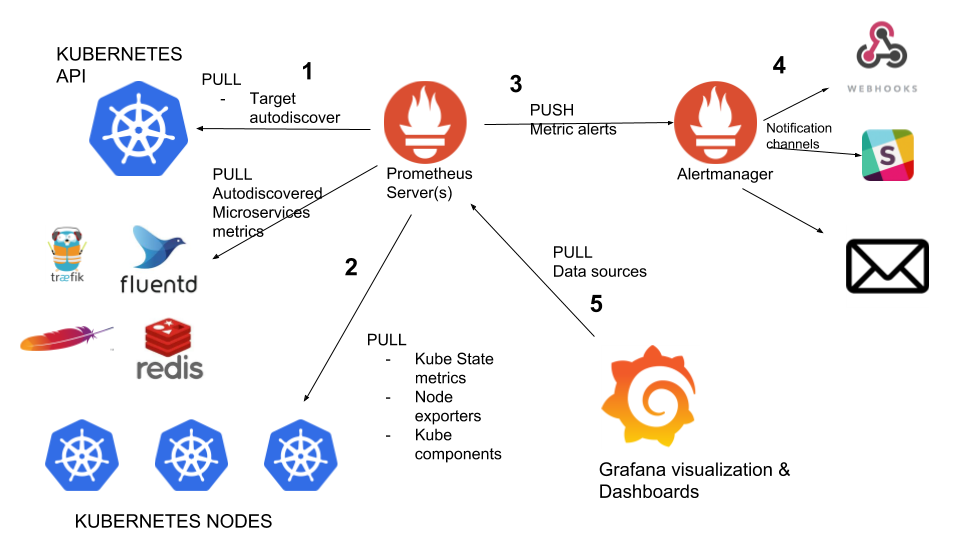
Prometheus is an open-source monitoring and alerting system that pulls metrics from application services, servers, and other target sources.
Prometheus advantages
Provides service discovery that is greatly integrated with Kubernetes, finding all services, and pulling metrics from Prometheus endpoints.
Prometheus always works, even if other parts of the infrastructure are broken. No need to install agents
Provides a functional query language, PromQL, that allows us to select and aggregate time-series data in real-time. It can apply subqueries, functions, and operators. It can filter and group by labels, and use regular expressions for improved matching and filtering
Prometheus disadvantages
Monitoring limits (required to increase server storage capacity or to limit the number of metrics).
Does not offer reliable long term data storage, anomaly detection, horizontal scaling, and user management.
Requires a bit of a work-around when it comes to push-based solutions for collecting metrics for short-lived jobs. Also some work-arounds can be made via Pushgateway since these metrics are only available for a short period of time.
Prometheus is not a dashboard solution.using Grafana for dashboarding is required when using Prometheus for monitoring.
ELK (Elasticsearch Stack: Elasticsearch, Logstash, Kibana)
Logstash features
We can have multiple pipelines running within the same Logstash instance. This means that Logstash is horizontally scalable.
Collect, parse, and analyse a large variety of structured and unstructured data and events.
Centralize data processing.
Decipher geo coordinates from IP addresses
Elasticsearch features
It is a NoSQL database providing distributed data storage
It provides detailed analyses by offering different query types such as structured, unstructured, geo, and metric data
Provide full-text search.
Use standard RESTful API and JSON, as it’s based on Apache Lucene.
Provide schema free, REST, and JSON distributed data storage.
Provide horizontal scalability, reliability, and capability to real-time search.
Provide security, monitoring, alerting, anomaly detection, anomaly prediction, graph exploration, and reporting features.
Kibana Features
Kibana is the visualization tool that pairs with Elasticsearch and Logstash
data can also be exported from Elasticsearch to Grafana for more advanced metrics visualization.
Provide real-time analysis, summarizing, charting, and debugging capabilities.
Allow snapshots sharing: share the link or export to PDF or CSV file and send it as an attachment.
Allow setting geo data on any map using Elastic Maps Service to visualize geospatial data.
Beats
ELK uses Beats, a collection of so-called data shippers
For example, there are Auditbeat for Linux audit logs, Filebeat for log files, Packetbeat for network traffic, and so on.
ELK advantages
Provides great insight into your distributed system with one ELK instance without the need to connect to hundreds of log data sources.
Elasticsearch is real-time. It means that an added document is available to explore after just seconds.
Ability to scale vertically and horizontally.
ELK disadvantages
Due to the Logstash and Elasticsearch being memory intensive, you need to do a lot of work to prevent Elastic nodes from going down.
Prometheus VS ELK
Both monitoring systems, Prometheus and ELK stack, have similar purposes.
Their goals are detecting problems, debugging, and solving issues.
The biggest difference is that ELK specializes in logs, and Prometheus specializes in metrics.
Most major productions require using both ELK and Prometheus
Prometheus VS ELK: the similarities
Both systems use RESTful HTTP/JSON API access methods.
Both systems use sharding methods for storing different data on different nodes
Both systems support different alerting options with integrations for email, Slack or PageDuty
Prometheus and ELK stack use replication methods for redundant storage of data on multiple nodes.
Prometheus VS ELK: the differences
Prometheus is used for metric collection, various systems monitoring and setting up alerts based on these metrics.
ELK is used to take all types of data, perform different types of analytics based on these data, search, and visualize it.
Prometheus uses TimeSeries DBMS as its primary database model.
ELK stack’s primary database model is a search engine that supports storing different unstructured data types with an inverted index that allows very fast full-text searches.
Prometheus uses its own PromQL which is actually very easy and powerful.
ELK provides domain-specific query language based on JSON. Elasticsearch also provides a feature to use SQL-like queries.
While Prometheus stores data identified by metric name and key/value pairs.
ELK uses a schema-free data scheme.
ELK collects a variety of logs from different sources, analyzes, and stores them
Prometheus collects metrics in a standard format via a pull method over HTTP.
Prometheus stores numeric examples of named time series.
In ELK stack, different types of data can be stored, such as numeric, string, boolean, binary, and so on. This lets you keep, analyze, and use data in a more efficient way regardless of the data.
Prometheus stores data locally within the instance, for a maximum of 14 days.Prometheus is not optimized to be a long-term metric store.
ELK provides more long-term data retention compared to Prometheus.
Kibana allows analyzing relationships in your data (show related products for example), and visualizations for these relationships.
Prometheus has no such extended features in its list, all analysis must be conducted through Grafana.
Use ELK in the following cases
You are doing event logging.
You need to process big amounts of log data.
You need long-term data storage.
You need to have deep insights into a specific event.
You need a clustered solution.
Use Prometheus in the following cases
You are primarily doing metrics.
You need simplicity in setting up monitoring and graphing tools.
You need run alerts across various sources.
https://www.metricfire.com/blog/prometheus-vs-elk/
- ELK/EFK compare with Splunk
Log Management, Log Analytics platform
collect and index logs and provide an interface to search , filter and interact with log data
Splunk has three components
Forwarder — is a component installed in the client machine and pushes data to remote indexers.
Indexers — Sorts and indexes the data pushed to it by forwarders and it responsible to provide index data to search requests.
Search head — is the front end web interface
ELK/ EFK are stacks
ElasticSearch — is basically a NoSQL database that uses Lucene search engine to search logs.
LogStash/FluentD — is a data processing and transportation pipeline which populates the ElasticSearch with the log data
Kibana — is a dashboard that works on top of ElasticSearch , provides UI to search, visualize and facilitates data analytics.
https://medium.com/@balajijk/elk-efk-compare-with-splunk-4c18fc362fd6
What is Prometheus?
Prometheus is an open-source monitoring tool and time-series database.
Prometheus provides powerful query language, storage, and visualization features for its users.
Prometheus can be integrated with many other different systems (for example, Docker, StatsD, MySQL, Consul, etc.).
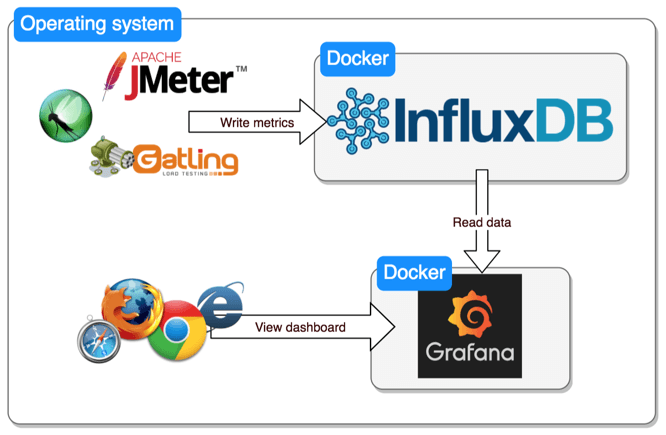
What is InfluxDB?
InfluxDB is an open-source time-series database
It is widely used as a system for monitoring applications, infrastructure, and IoT, as well as for data analysis
InfluxDB has its own ecosystem called TICK-stack consisting of four components: Telegraf, InfluxDB, Chronograf, and Kapacitor
InfluxDB is the central component of this stack. Its primary aim is to store data, while Telegraf acts as a data collector, Kapacitor provides tools for real-time data processing (for example, alerting), and Chronograf is the system for visualization and interaction with all other components of the stack.
Key similarities between Prometheus and InfluxDB
Both Prometheus and InfluxDB are tools for monitoring and storing time-series data.
Both platforms support multi-dimensional data. This is done by using labels in Prometheus and tags in InfluxDB.
Both systems have additional instruments to deal with specific tasks. For example, InfluxDB has Kapacitor, and Prometheus has Alertmanager for alerting purposes.
They both use query languages to interact with metrics and analyse them.
If for some use cases it is not enough to use the existing plugins, the functionality of both systems can be extended with the help of web hooks.
Key differences between Prometheus and InfluxDB
. Both systems could be used for monitoring and time-series data storing. However, InfluxDB is more known as a time-series database, while Prometheus has a broader scope of monitoring purposes.
InfluxDB itself cannot be used for the tasks of data visualization or alerting.We should use other instruments from the TICK-stack: Kapacitor for alerting and Chronograf for visualization
Prometheus also needs to use Alertmanager to send notifications, but defining the alerting and recording rules can be done directly in the Prometheus interface.
Prometheus can write data with the millisecond resolution timestamps. InfluxDB is more advanced in this regard and can work with even nanosecond timestamps.
Prometheus uses an append-only file per time-series approach for storing data. InfluxDB uses another method of storing, that is considered better for working with events logging.
https://www.metricfire.com/blog/prometheus-vs-influxdb/
- InfluxDB is a time series database optimized for high-availability storage and rapid retrieval of time series data.
It can work as a stand-alone solution, or it can be used to process data from Graphite
In addition to monitoring, InfluxDB is used for the Internet of things, sensor data, and home automation solutions
https://logz.io/blog/monitoring-kubernetes-grafana-influxdb/
- Grafana ships with built-in support for Jaeger, which provides open source, end-to-end distributed tracing.
You can link to Jaeger trace from logs in Loki by configuring a derived field with internal link
https://grafana.com/docs/grafana/latest/datasources/jaeger/
- Grafana ships with built-in support for Loki, Grafana’s log aggregation system.
Querying Logs
Querying and displaying log data from Loki is available via Explore, and with the logs panel in dashboards. Select the Loki data source, and then enter a LogQL query to display your logs.
Live tailing
Loki supports Live tailing which displays logs in real-time. This feature is supported in Explore.
https://grafana.com/docs/grafana/latest/datasources/loki/
- Using Graphite in Grafana
Grafana has an advanced Graphite query editor that lets you quickly navigate the metric space, add functions, change function parameters and much more. The editor can handle all types of graphite queries.
https://grafana.com/docs/grafana/latest/datasources/graphite/
- The Relationship Between Observability and Monitoring
Observability and monitoring tools work together to offer robust insight into the health of your IT infrastructure. While monitoring alerts the team to a potential issue, observability helps the team detect and solve the root cause of the issue.
Observability is essential for developers to effectively perform root cause analysis and debug their systems.
With observability software, developers can do this work more easily than if they relied solely on monitoring tools, including telemetry and APM tools.
https://www.strongdm.com/blog/observability-vs-monitoring#:~:text=While%20monitoring%20alerts%20the%20team,root%20cause%20of%20the%20issue.
- Monitoring, by textbook definition, is the process of collecting, analyzing, and using information to track a program’s progress toward reaching its objectives and to guide management decisions.
Monitoring focuses on watching specific metrics. Logging provides additional data but is typically viewed in isolation of a broader system context.
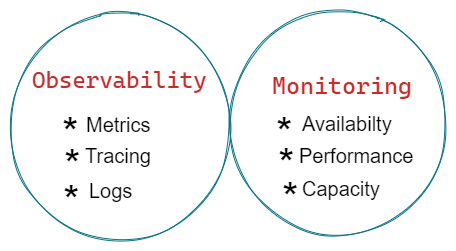
Observability is the ability to understand a system’s internal state by analyzing the data it generates, such as logs, metrics, and traces. Observability helps teams analyze what’s happening in context across multicloud environments so you can detect and resolve the underlying causes of issues.
Monitoring is capturing and displaying data, whereas observability can discern system health by analyzing its inputs and outputs.
For example, we can actively watch a single metric for changes that indicate a problem — this is monitoring. A system is observable if it emits useful data about its internal state, which is crucial for determining root cause.
https://www.dynatrace.com/news/blog/observability-vs-monitoring/
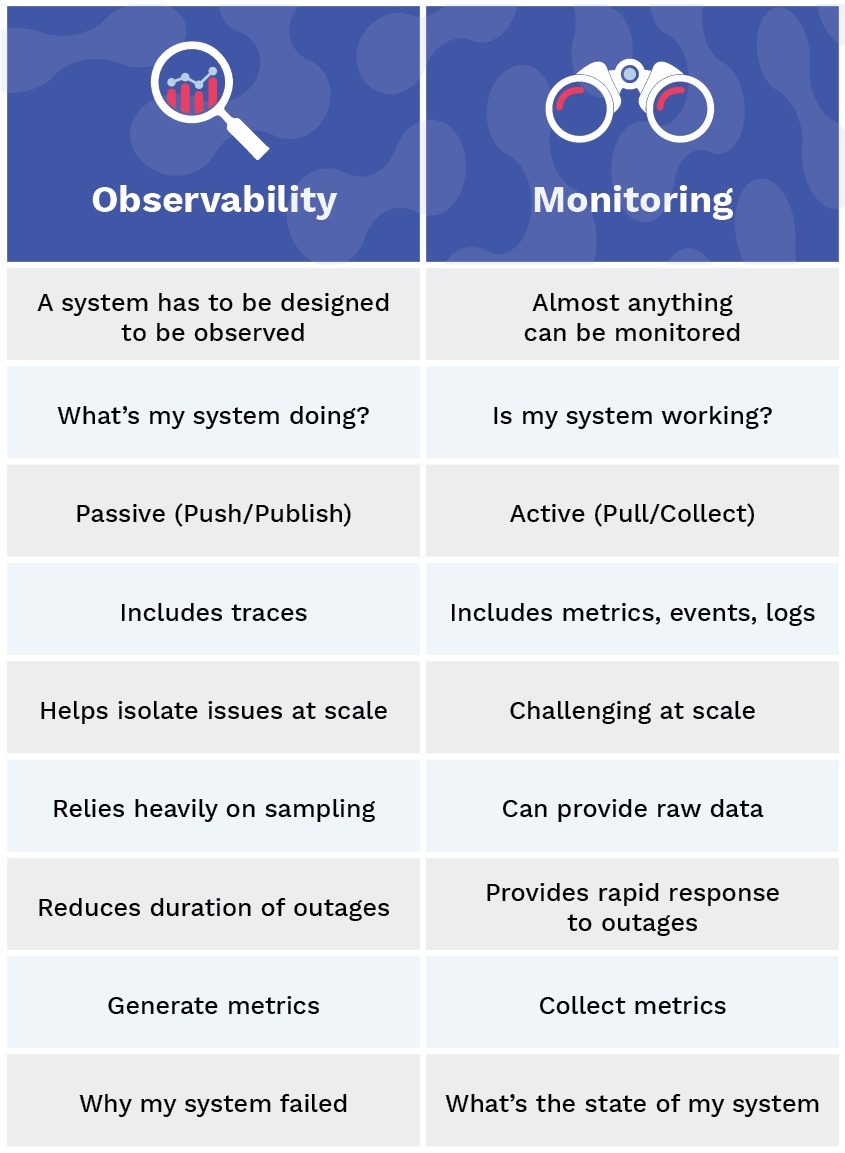
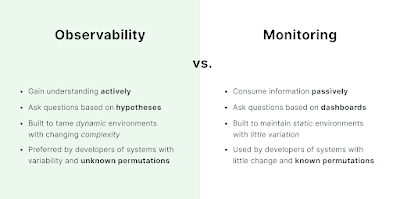
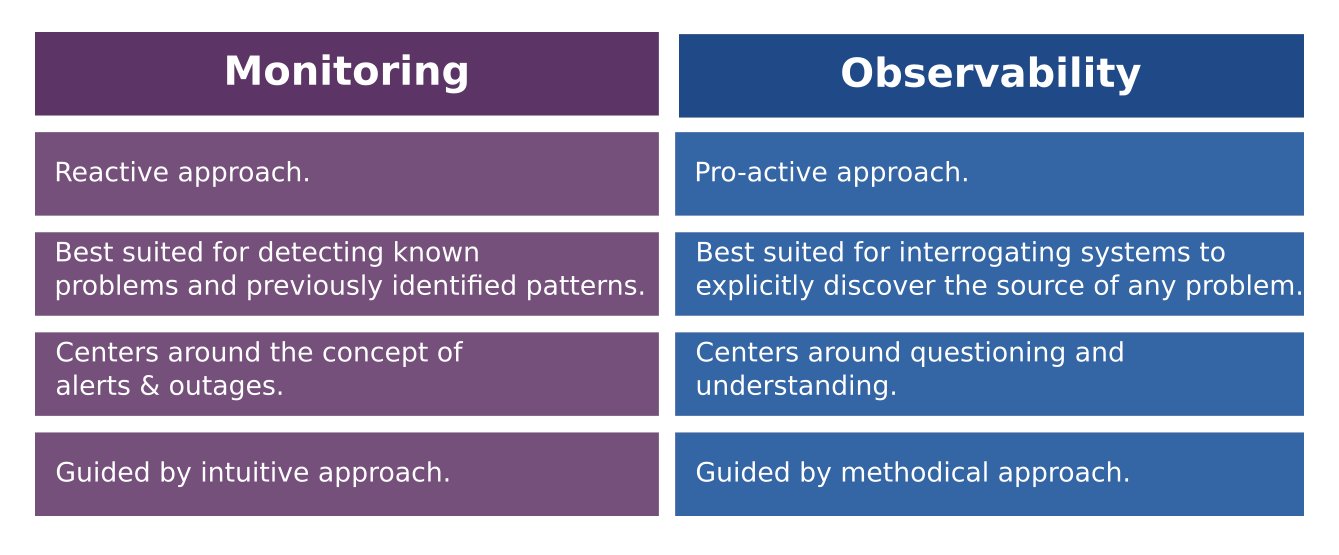
- Monitoring is tooling or a technical solution that allows teams to watch and understand the state of their systems. Monitoring is based on gathering predefined sets of metrics or logs.
Observability is tooling or a technical solution that allows teams to actively debug their system. Observability is based on exploring properties and patterns not defined in advance.
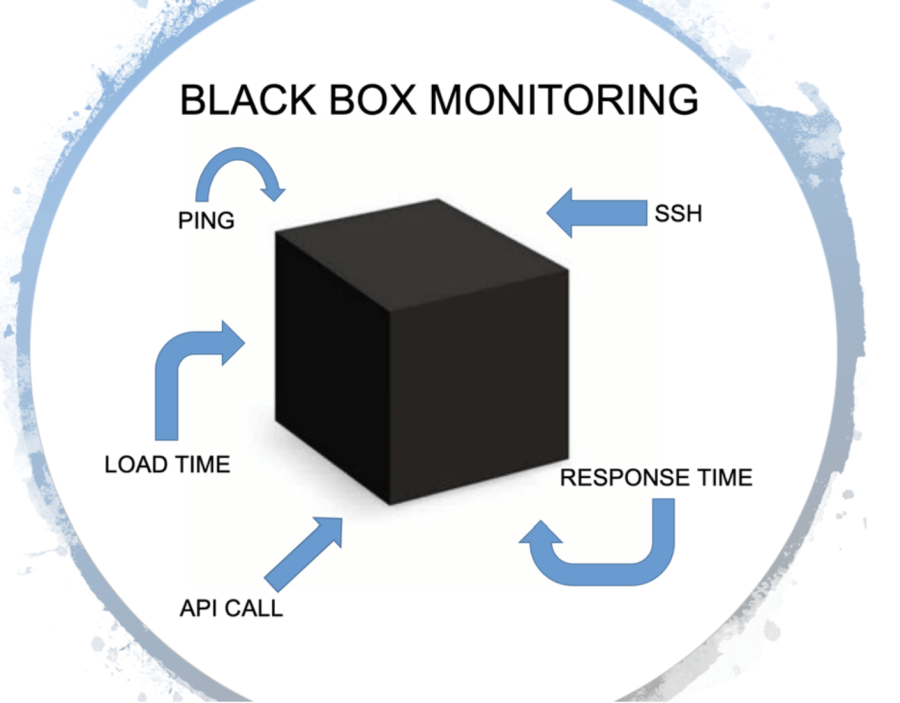
Blackbox monitoring
In a blackbox (or synthetic) monitoring system, input is sent to the system under examination in the same way a customer might. This might take the form of HTTP calls to a public API, or RPC calls to an exposed endpoint, or it might be calling for an entire web page to be rendered as a part of the monitoring process.
Whitebox monitoring
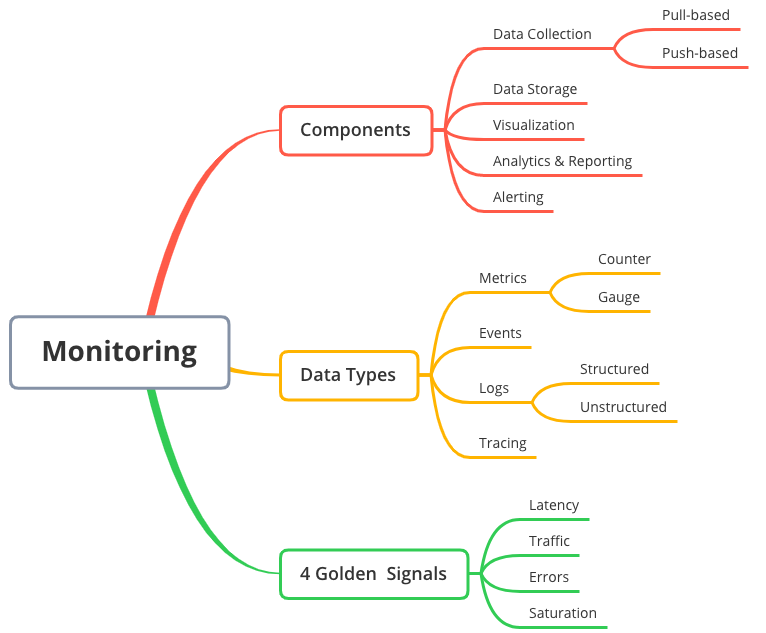
Monitoring and observability rely on signals sent from the workload under scrutiny into the monitoring system. This can generally take the form of the three most common components: metrics, logs, and traces
Metrics are simply measurements taken inside a system, representing the state of that system in a measurable way.
Logs can be thought of as append-only files that represent the state of a single thread of work at a single point in time.
Traces are composed of spans, which are used to follow an event or user action through a distributed system.
https://cloud.google.com/architecture/devops/devops-measurement-monitoring-and-observability
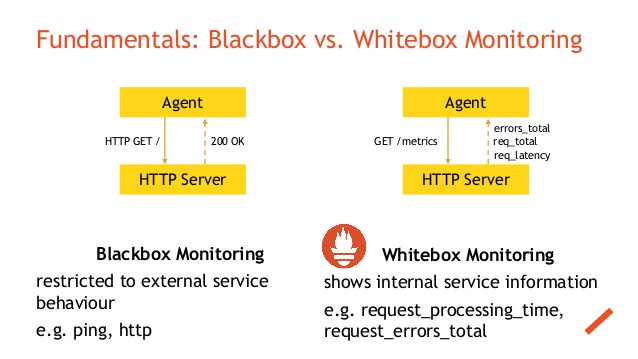


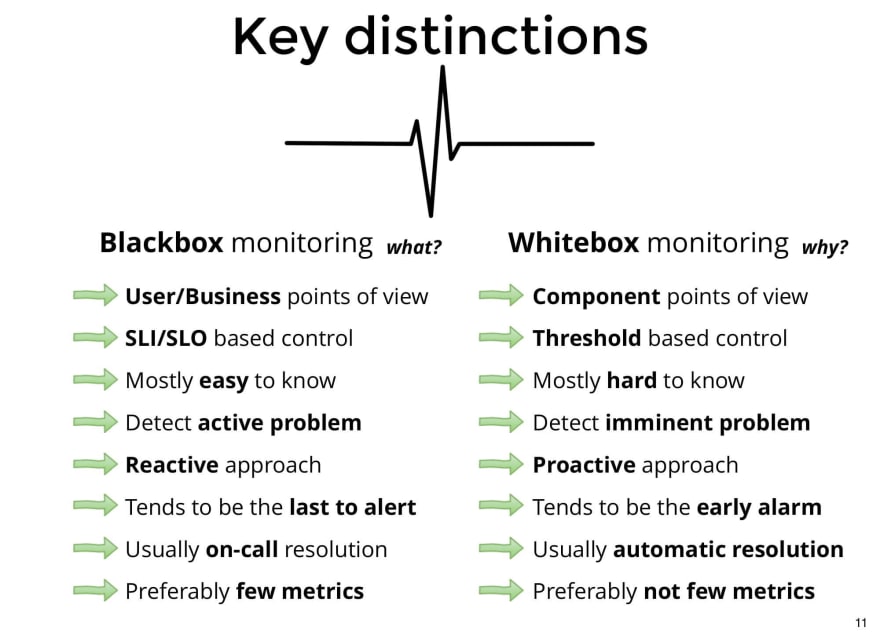
This type of monitoring mainly refers to the monitoring the internal states of the applications running on your system. Mainly this type of monitoring involves exposing metrics that are specific to your application like total number of http requests received / latency etc.
Black Box Monitoring
This type of monitoring mainly refers to the monitoring state of services in the system. Using this type of monitoring we ensure things like status of the application being alive or dead , cpu / disk usage etc
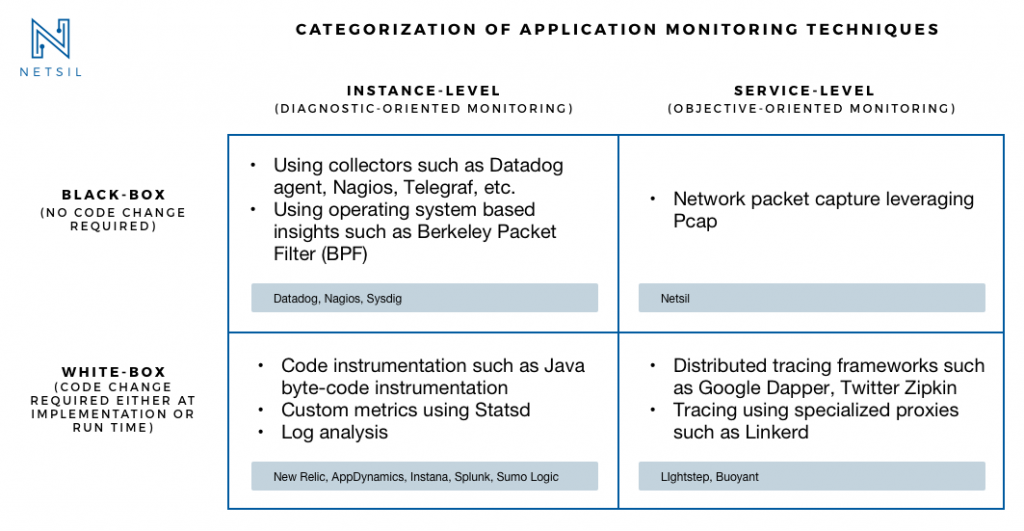
Using the Black Box Monitoring involves using tools like Nagios , Zabbix which are mainly based on the ideas of running custom checks on the systems to identify status of various applications / services whose response are mainly as 0 or 1 to indicate the status of the service being monitored.
Whereas using white box monitoring involves using tools like Prometheus which enables you to export metrics like total number of http requests received by the application , errors logged etc.
If the disk space of a system is filling up fast and goes beyond 80% the black box monitoring tools would throw alerts with high risk to be fixed. But the problem arises if we want to fix the alerts then we want to know some metrics about the system like the rate at which disk capacity was increasing on the system , the internal application metrics about disk usage. Knowing these metrics can help us solve the issues in lesser time.
If we have a white box monitoring solution enabled for the same scenario then observing the graphs for rate of disk capacity usage and application disk usage for some specific timelines we can make predictions about trend at which disk capacity was filling up also make our predictions of which app may be behaving faulty at this scenario and knowing these specifics can help us resolve the issues with less time.
https://www.linkedin.com/pulse/white-box-vs-black-monitoring-vipul-sharma