Sunday, June 9, 2019

WAN optimization (WAN acceleration)


  • WAN Optimization Protocol Spoofing

Protocol Spoofing is an essential part of data communications that helps to enhance performance
Protocol spoofing evolved in the 1980s and is used as a data compression technique to improve throughput levels and thereby increase performance.
While used as a data compression technique, the protocol headers and trailers are either removed completely or cut down, and finally reconstructed at the end points
The technique of protocol spoofing involves communication devices (modem, router), host machines, compatible remote devices and communication links

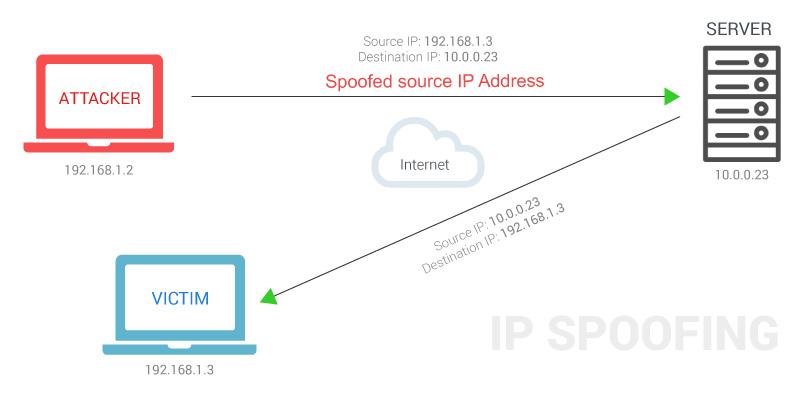
Spoofing, in computer security, pertains to different forms of data falsification or misrepresentation. The forgery of headers to send out misleading information is a form of spoofing. While protocol spoofing generally refers to the method of enhancing performance, there are many other types of protocol spoofing that perform different functions â“ both advantageous and disadvantageous

Transmission Control Protocol (TCP) Spoofing
TCP spoofing enables to reduce transmission delays and performance limitation due to higher bandwidth. The algorithm used by TCP greatly causes delays in connections during startup. TCP spoofing involves a spoofing router, which terminates the local TCP connection and interprets the TCP to protocols that have the capacity to reduce long delays across satellite links.

File Transfer Spoofing
File Transfer Protocols and Error Correction Protocols operate through computing and assigning a checksum for a data packet

RIP/SAP Spoofing
RIP and SAP are used for broadcasting network information in a periodic way.

The other types of spoofing techniques that are involved in misrepresentation of information are Address Resolution Protocol (ADP) Spoofing, Internet Protocol (IP) Address Spoofing, etc. Those protocol spoofing techniques that adversely affect the users can be controlled by using counter methods such as packet filtering, egress filtering, data authorization and other techniques.
https://www.wanoptimization.org/protocol_spoofing.php


  • WAN optimization (WAN acceleration)

WAN optimization, also known as WAN acceleration, is the category of technologies and techniques used to maximize the efficiency of data flow across a wide area network (WAN).

WAN optimization encompasses:

    traffic shaping, in which traffic is prioritized and bandwidth is allotted accordingly.
    data deduplication, which reduces the data that must be sent across a WAN for remote backups, replication, and disaster recovery.
    compression, which shrinks the size of data to limit bandwidth use.
    data caching, in which frequently used data is hosted locally or on a local server for faster access.
    monitoring the network to detect non-essential traffic.
    creating and enforcing rules about downloads and Internet use.
    protocol spoofing, which is a method of bundling chatty protocols so they are, in effect, a single protocol.

https://searchnetworking.techtarget.com/definition/WAN-optimization-WAN-acceleration

  • How WAN Optimization Works 

WAN performance issues
    Latency: This is the back-and-forth time resulting from chatty applications and protocols, made worse by distance over the WAN. One server sends packets, asks if the other server received it, the other server answers, and back and forth they go. This type of repeated communications can happen 2,000 to 3,000 times just to send a single 60MB Microsoft PowerPoint file. A somewhat simple transaction can introduce latency from 20 ms to 1,200 ms per single file transaction.
    TCP window size: Adding more bandwidth won’t necessarily improve WAN performance. Your TCP window size limits throughput for each packet transmission. While more bandwidth may give you a bigger overall pipe to handle more transactions, each specific transaction can only go through a smaller pipe, and that often slows application performance over the WAN.

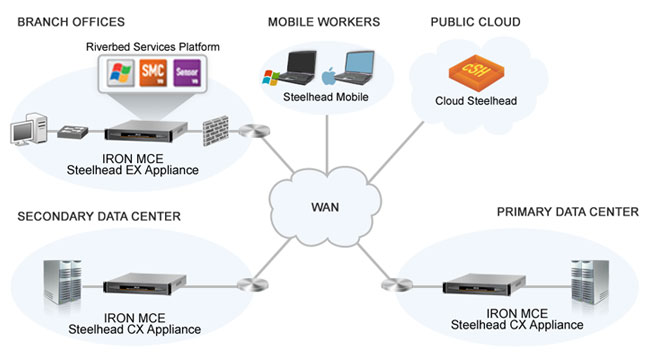
SteelHead is a bookend technology in which one Steelhead sits at the data center and another at the edge. SteelHead works with any WAN because it sits behind routers, which terminate the WAN at each end.
The bookended SteelHead analyzes each packet as it goes on and off the routers.

SteelHead, utilizes a combination of three technologies to boost WAN performance.
#1. Data streamlining
 Don’t resend redundant data: A process known as data de-duplication removes bytes from the WAN. Data that is accessed repeatedly by users over the WAN is not repeatedly resent
 Scalable data referencing looks at data packets: Let’s say a user downloads a document from a file server. At the sending and receiving locations, SteelHead sees the file and breaks the document into packets and stores them. Then the user modifies the document and emails it back to 10 colleagues at the file’s original location. In this case the only data sent over the WAN are the small changes made to the document and the 16-byte references that tells the SteelHead device at the other end how to reassemble the document.
 SteelHead cares about data: Data is data to SteelHead, no matter what format or application it comes from. That means far less of it needs to be sent across the WAN. As an example, imagine how many times the words “the” and “a” appear in files from various applications. SteelHead doesn’t care; these bytes look the same and therefore need not be sent. This type of de-duplication can remove 65–95% of bytes from being transmitted over the WAN.

#2. Transport streamlining
The fastest round trip is the one you never make: Transport streamlining makes TCP more efficient, which means fewer round trips and data per trip. For example, traditional TCP does what’s known as a “slow start process,” where it sends information in small chunks and keeps sending increasingly larger chunks until the receiving server can’t handle the chunk size. Then it starts again back at square one and repeats the process. Transport streamlining avoids the restart and just looks for the optimal packet size and sends packets only in that size

#3. Application streamlining
Lastly, application streamlining is specially tuned for a growing list of application protocols including CIFS, HTTP, HTTPS, MAPI, NFS, and SQL.
https://www.riverbed.com/newsletter/how-wan-optimization-works.html


Thursday, June 6, 2019

Linux Introspection & Profiling


  • SystemTap

SystemTap is a GPLv2 license system wide tool that allows you to gather tracing and profiling data from a running Linux system.
Understanding systemtap

    Systemtap connects to the Linux kernel and monitors for available events, which are exposed through the kprobes kernel facility
    Based on an event, the kernel can run a handler which is executed as a sub routine
    The event and handler together are refers as probe
    Stap is doing its work by running scripts. To work, these scripts you need to compile the stap scripts in the kernel and start it as a kernel module. The kernel module next will do its work and after doing so it will unload
    The stap command will run the scripts and do the compilation

https://www.golinuxcloud.com/systemtap-tutorial-linux-example/


  • Linux introspection and SystemTap


SystemTap is a dynamic method of monitoring and tracing the operation of a running Linux kernel.
An interface and language for dynamic kernel analysis

Kernel tracing
SystemTap is similar to an older technology called DTrace, which originated in the Sun Solaris operating system. Within DTrace, developers can write scripts in the D programming language (a subset of the C language but modified to support trace-specific behaviors). A DTrace script contains a number of probes and associated actions that occur when the probe "fires." For example, a probe can represent something as simple as invoking a system call or more complicated interactions such as a particular line of code being executed.

https://www.ibm.com/developerworks/linux/library/l-systemtap/

  • SystemTap provides a command line interface and a scripting language to examine the activities of a running Linux system, particularly the kernel, in fine detail. SystemTap scripts are written in the SystemTap scripting language, are then compiled to C-code kernel modules and inserted into the kernel.

https://doc.opensuse.org/documentation/leap/tuning/html/book.sle.tuning/cha.tuning.systemtap.html

  • OProfile

OProfile is a low overhead, system-wide performance monitoring tool provided by the oprofile package.
It uses the performance monitoring hardware on the processor to retrieve information about the kernel and executables on the system, such as when memory is referenced, the number of second-level cache requests, and the number of hardware interrupts received. OProfile is also able to profile applications that run in a Java Virtual Machine (JVM)
https://access.redhat.com/documentation/en-us/red_hat_enterprise_linux/6/html/developer_guide/oprofile

  • Learn eBPF Tracing: Tutorial and Examples

It can be used for many things: network performance, firewalls, security, tracing, and device drivers.
The term tracing refers to performance analysis and observability tools that can produce per-event info.

What is eBPF, bcc, bpftrace, and iovisor?
eBPF does to Linux what JavaScript does to HTML. (Sort of.) So instead of a static HTML website, JavaScript lets you define mini programs that run on events like mouse clicks, which are run in a safe virtual machine in the browser. And with eBPF, instead of a fixed kernel, you can now write mini programs that run on events like disk I/O, which are run in a safe virtual machine in the kernel
http://www.brendangregg.com/blog/2019-01-01/learn-ebpf-tracing.html

  • 5.4. Performance Counters for Linux (PCL) Tools and perf

Performance Counters for Linux (PCL) is a new kernel-based subsystem that provides a framework for collecting and analyzing performance data.

The PCL subsystem can be used to measure hardware events, including retired instructions and processor clock cycles. It can also measure software events, including major page faults and context switches. For example, PCL counters can compute the Instructions Per Clock (IPC) from a process's counts of instructions retired and processor clock cycles. A low IPC ratio indicates the code makes poor use of the CPU. Other hardware events can also be used to diagnose poor CPU performance.

Both OProfile and Performance Counters for Linux (PCL) use the same hardware Performance Monitoring Unit (PMU).

https://access.redhat.com/documentation/en-us/red_hat_enterprise_linux/6/html/developer_guide/perf

  • Perf is a profiler tool for Linux 2.6+ based systems that abstracts away CPU hardware differences in Linux performance measurements and presents a simple commandline interface.

https://www.dedoimedo.com/computers/linux-perf.html

  • perf Examples

the perf Linux profiler
Performance Counters for Linux (PCL)
perf_events is an event-oriented observability tool,which can help you solve advanced performance and troubleshooting functions
perf_events is part of the Linux kernel
While it uses many Linux tracing features, some are not yet exposed via the perf command, and need to be used via the ftrace interface instead

    Why is the kernel on-CPU so much? What code-paths?
    Which code-paths are causing CPU level 2 cache misses?
    Are the CPUs stalled on memory I/O?
    Which code-paths are allocating memory, and how much?
    What is triggering TCP retransmits?
    Is a certain kernel function being called, and how often?
    What reasons are threads leaving the CPU?


http://www.brendangregg.com/perf.html#Tracepoints

  • Valgrind

Valgrind is an instrumentation framework for building dynamic analysis tools that can be used to profile applications in detail. The default installation alrready provides five standard tools. Valgrind tools are generally used to investigate memory management and threading problems.
https://access.redhat.com/documentation/en-us/red_hat_enterprise_linux/6/html/developer_guide/profiling#valgrind


  • FTRACE

The ftrace framework provides users with several tracing capabilities, accessible through an interface much simpler than SystemTap's. This framework uses a set of virtual files in the debugfs file system; these files enable specific tracers. The ftrace function tracer outputs each function called in the kernel in real time; other tracers within the ftrace framework can also be used to analyze wakeup latency, task switches, kernel events, and the like.
https://access.redhat.com/documentation/en-us/red_hat_enterprise_linux/6/html/developer_guide/ftrace

Monday, June 3, 2019

Security Automation and Orchestration (SOAR)

  • Security Automation and Orchestration (SOAR)
SOC 3D is the first Security Automation and Orchestration (SOAR) platform combining automation, orchestration, and big-data powered investigation into a single and comprehensive incident response platform that triples SOC efficiency, provides unprecedented visibility and reduces time-to-respond by 90%.
https://www.cyberbit.com/solutions/security-operations-automation-orchestration/

  • The Evolution of SOAR Platforms
he “single pane of glass”—the term for a single unified console that has all the information an analyst needs—is something of a holy grail in the security operations world. Unfortunately, vendors often exaggerate their ability to deliver this type of interface. However, the evolution of SOAR platforms is bringing them very close to realizing the vision of a centralized dashboard.
https://www.securityweek.com/evolution-soar-platforms


  • How to build an incident response playbook

An incident response playbook is defined as a set of rules, describing at least one action to be executed with input data and triggered by one or more events. It is a critical component of cybersecurity—especially in relation to security orchestration, automation and response (SOAR)
Here are the steps the IACD recommends following to construct an incident response playbook:

    Identify the initiating condition.
    List all possible actions that could occur in response to the initiating condition.
    Categorize all possible actions into “required” and must occur to mitigate the threat, or “optional” and considered more of a best practice.
    Build the playbook process order using only the “required” elements determined in step 3.
    Determine if steps from the “optional” category can be grouped by activity or function (e.g., monitoring, enriching, responding, verifying, or mitigating).
    Modify the process created in step 4 to indicate where any optional processes would occur.
    Insert the categorized optional actions into the options box below the process steps box.
    Identify the end state or another initiating condition to another playbook.
    List the regulatory laws and requirements that the playbook satisfies.
https://swimlane.com/blog/incident-response-playbook/
Incident Response Playbook Example
Intelligently Automate Incident Response 

  • Automated Website Unblock Requests


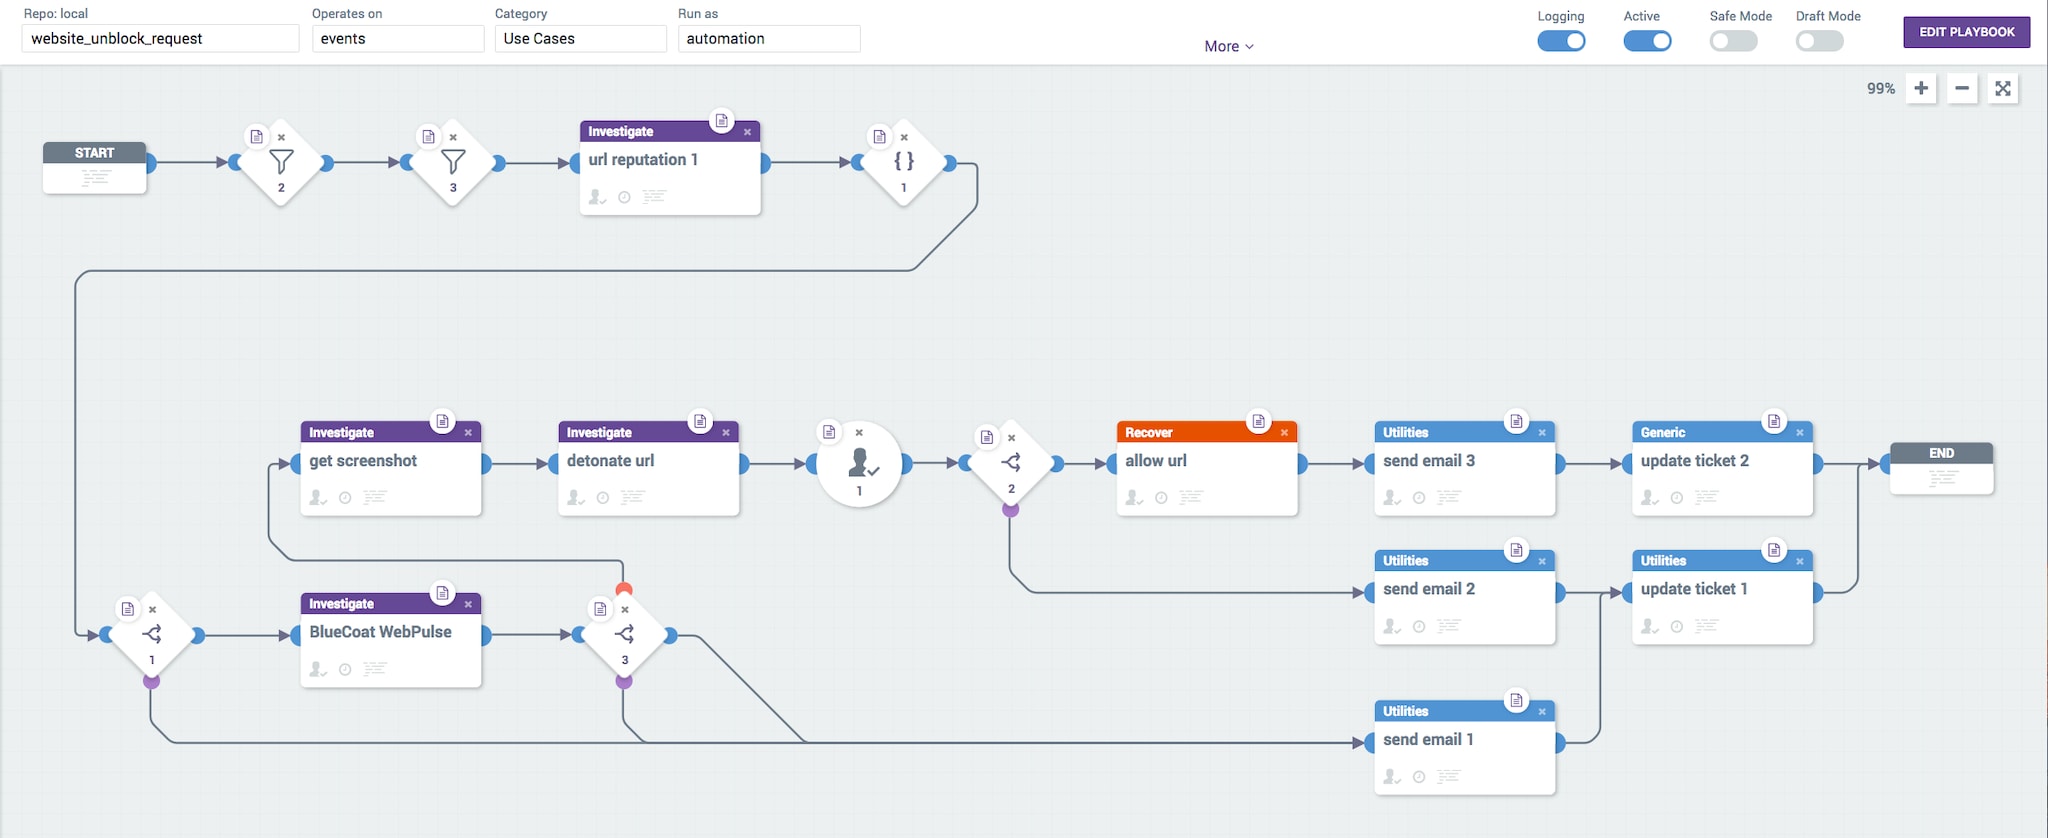
Another good example of an automation worthy processes is website unblock requests. Many organizations use a web proxy to block unwanted and/or malicious web traffic. Sometimes these proxies block sites necessary for employees to do their job, so the employees have to specifically request access to the blocked sites. Normally, this process involves a security analyst doing some research on the requested site to determine if it is ok for the employee to visit. Why not automate that process for greater efficiency? When given the blocked URL, either in a defined Common Event Format (CEF) field or through parsing and extracting the URL from an existing ticket in your current IT service management platform (e.g. ServiceNow, JIRA, BMC Remedy, etc.), perform some automated lookups on the URL to see if it’s “known bad” from the reputation services you use, get a screenshot of the URL and/or detonate it in a Sandbox.
https://www.splunk.com/blog/2017/11/02/playbooks-going-beyond-incident-response-use-cases.html
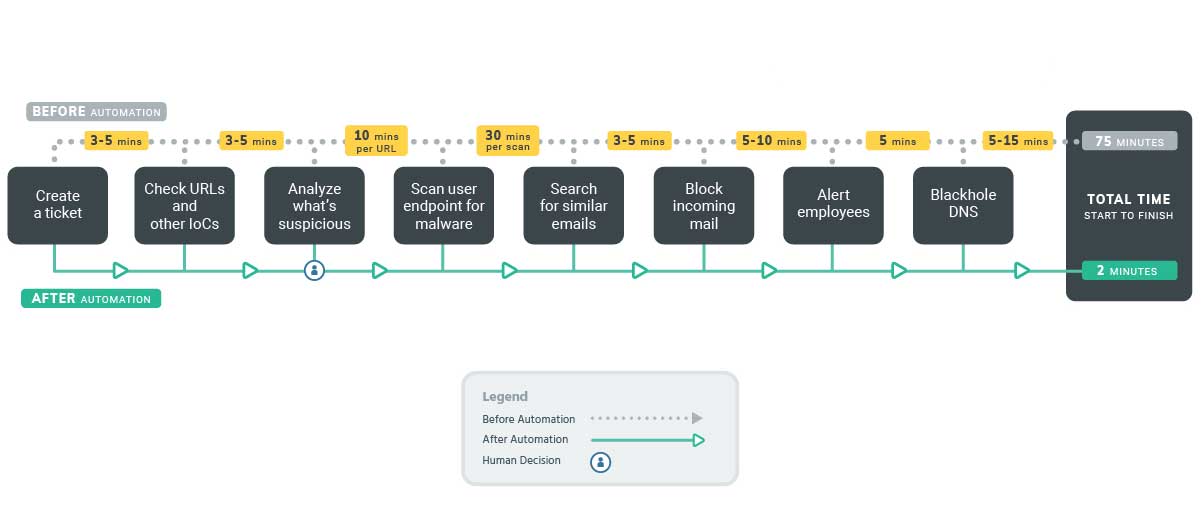
  • Phishing remains the most common attack vector behind successful breaches. However, investigating phishing emails involves time-consuming, manual tasks such as investigating and detonating attachments, checking URLs, or following up on suspicious requests for sensitive information. Orchestration and automation solutions can execute tasks like these behind the scenes while your team works on the rest of your investigation and response, ensuring the situation is handled effectively and efficiently while accelerating response time. Outside of the investigations, you can also build workflows to automate remediation steps for when a phishing email is identified.


Scan attachments and URLs
Use plugins for safe browsing, sandboxes, and more to contain and investigate suspicious attachments and check suspicious URLs.
Workflows to identify threats
Leverage workflows to analyze email URLs and file attachments using multiple intelligence sources. Add steps to output reports detailing each indicator identified.
Designate decision points
After the routine scans and investigations have occurred, configure workflows to trigger a decision point on how best to proceed. Examples include marking as verified phish, automatically posting a message alerting others in your organization to the phishing threat via Slack, and other actions.


Provisioning new accounts
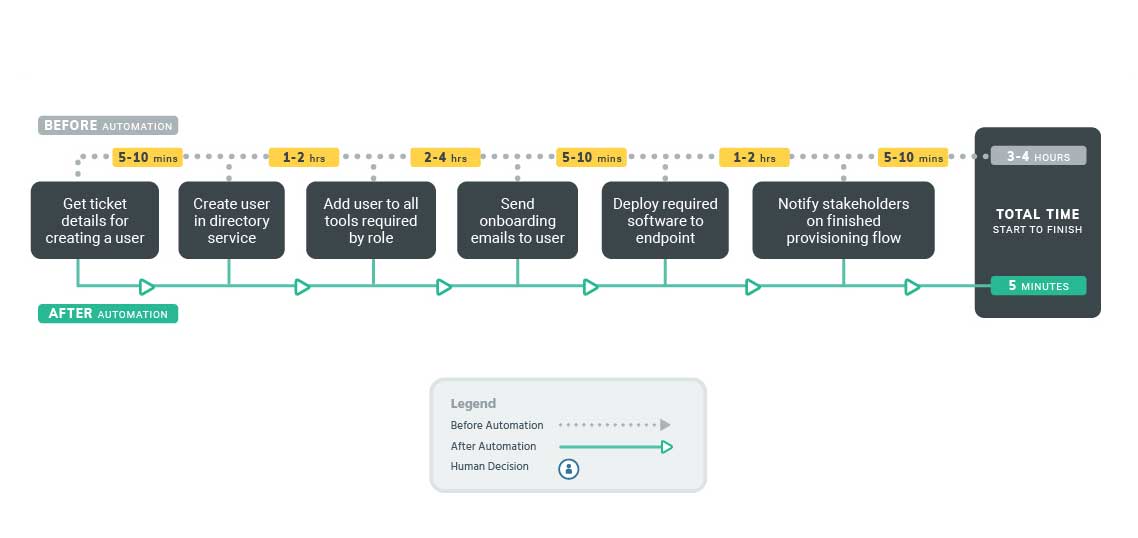
Different employees require different access levels to various tools and systems within your organization. Easily orchestrate tools such as Okta or Active Directory together, and kick off automation regarding designated user accounts.

Deprovisioning departing employees
No matter the reason why an employee is leaving, it’s a security best practice to remove access to their account as quickly as possible. When an employee leaves, security and IT teams can immediately deactivate the account via a single automated workflow.
Shutting the [access] doors

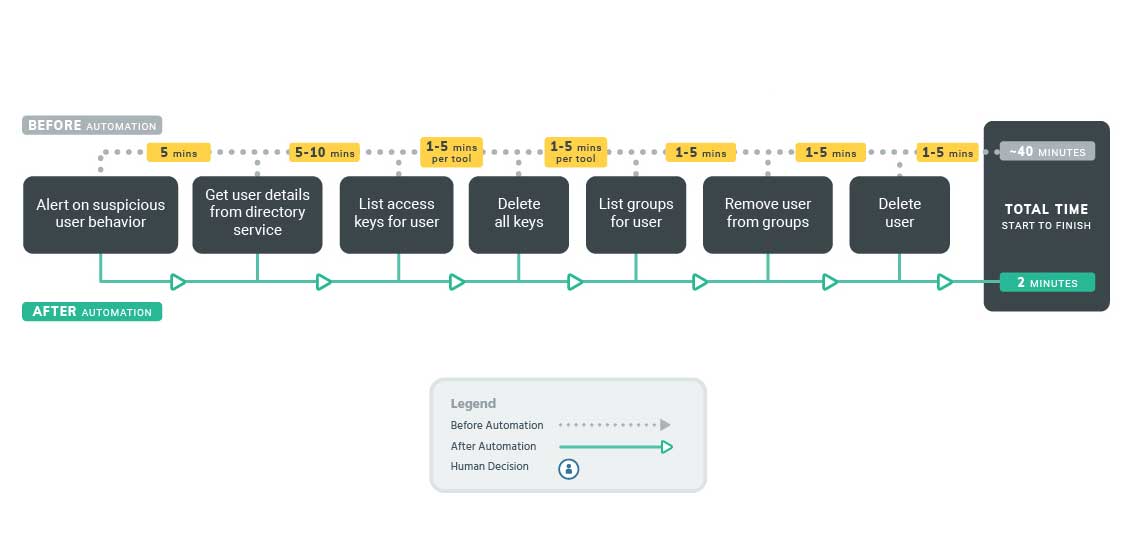
User accounts are commonly exploited in phishing attacks. In the event of an incident, automatically deprovision affected user accounts, remove user access from key systems, and revoke permissions as needed until the threat is contained.

Identify malicious activity
When dealing with malware, it’s important to know the signs to look for and how to stop malware in a timely manner to reduce the spread of infection. Automate processes to identify indicators like misspelled process names or abnormal log activity.
Investigate the threat
When malware is detected, leverage workflows to analyze it using plugins from today’s leading malware analysis solutions and common sandbox tools, such as Cuckoo. You’ll be able to investigate malicious files in a safe space, before they get into your network.
Containment and removal
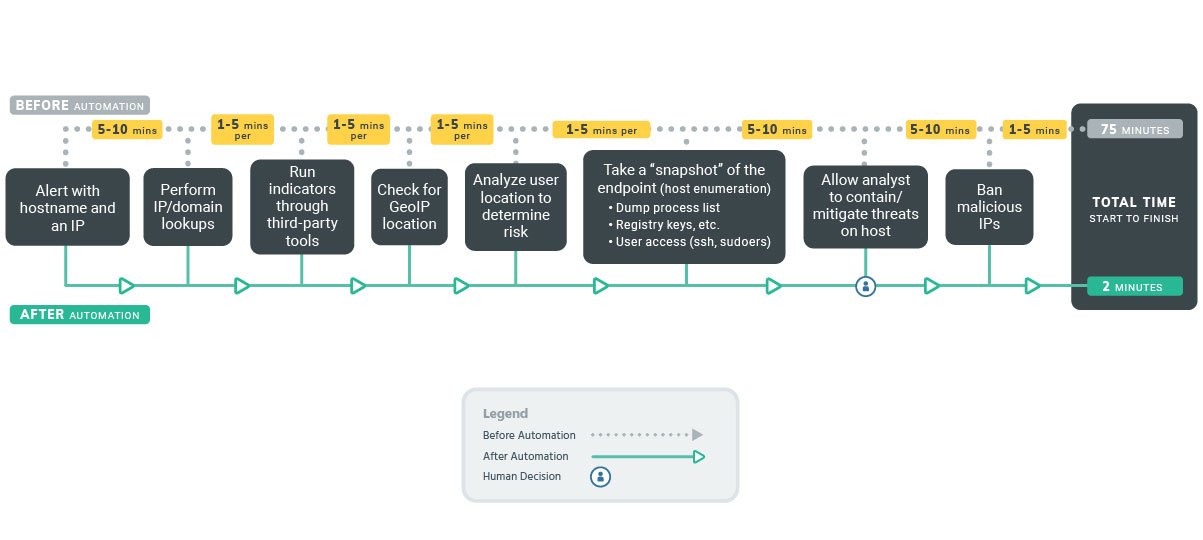
All malware will require some type of containment/removal action. Leverage automation to identify the affected users and assets, leaving decision points for security practitioners to remove the necessary user accounts, isolate the malware, or disconnect machines from the network

Alert Enrichment
Leave the heavy-lifting to the machines
Reduce the noise

ChatOps: Distributed Alerting
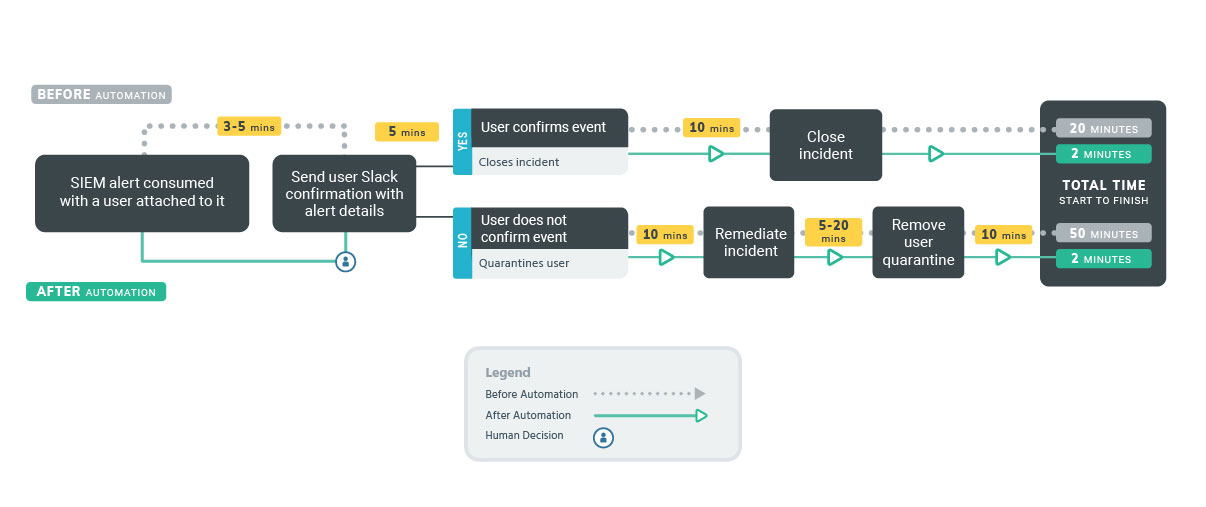
Teams are always striving to reduce the time between security alert generation and resolution to a theoretical null. First popularized by the security team at Slack, a Distributed Alerting strategy avoids alert fatigue and staffing issues in the SOC by immediately bringing up alerts into the Slack instance of the person who generated it. Augmented with multi-factor authentication (MFA), analysts spend less time dealing with multiple alerts and more time triaging true positives due to a better signal-to-noise ratio.


Streamline business operations
Trigger actions to push comments to solutions like JIRA or Slack. With your security ecosystem set up to deliver alerts,incident notifications, and other data via your existing tools, security operations become more streamlined, collaborative, and efficient.
Two-way flow of information
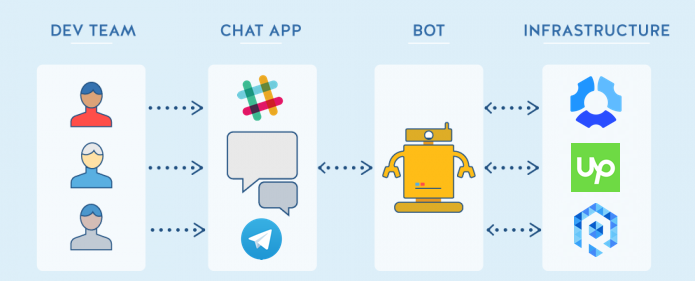
Automation can deliver alerts that come in from your security tools straight into your chat applications and delegate tasks back to other connected tools, making communication and case management bi-directional.

Threat Hunting
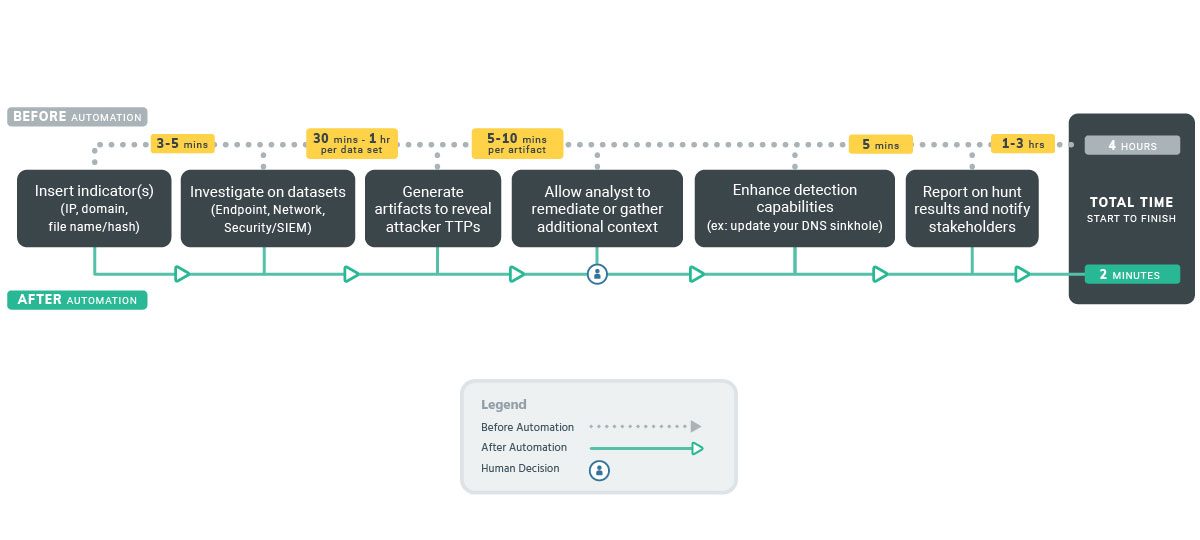
being proactive in this area can enable your analysts to better uncover and defend against complex advanced persistent threats (APTs)—the attacks that are almost guaranteed to succeed and that, with a massive dwell time, allow attackers to wreak widespread havoc.
The more data sets you are able to analyze, the more thorough your proactive search for compromise will be. With orchestration, you can easily add additional tools to your data set without adding substantial time to your hunt cycle.
Automate repeatable tasks
By automating the ongoing tasks associated with threat hunting, such as recurring scans, your team will have more time to do what they do bes 
Notify and respond faster
Create and kick off designated response workflows based on the type of threat you’ve discovered. 

Monitor advisory lists
Coordinating vendor vulnerability response used to be a manual process requiring multiple stakeholders. With an automation solution, you can build workflows to automatically monitor advisory lists via RSS feed plugins, and set up decisions and action points as needed.
Notify stakeholders
When a vulnerability needs to be addressed, automatically trigger the creation of service tickets via integrations with leading solutions like JIRA and ServiceNow.

https://www.rapid7.com/info/security-orchestration-and-automation-playbook/
Sample Workflow
Phishing Investigations
Sample Workflows
Provisioning Users
Sample Workflows
Deprovisioning Users
Sample Workflow
Alert Enrichment
Sample Workflow
ChatOps: Distributed Workflow
Sample Workflow
Threat Hunting
Sample Workflow
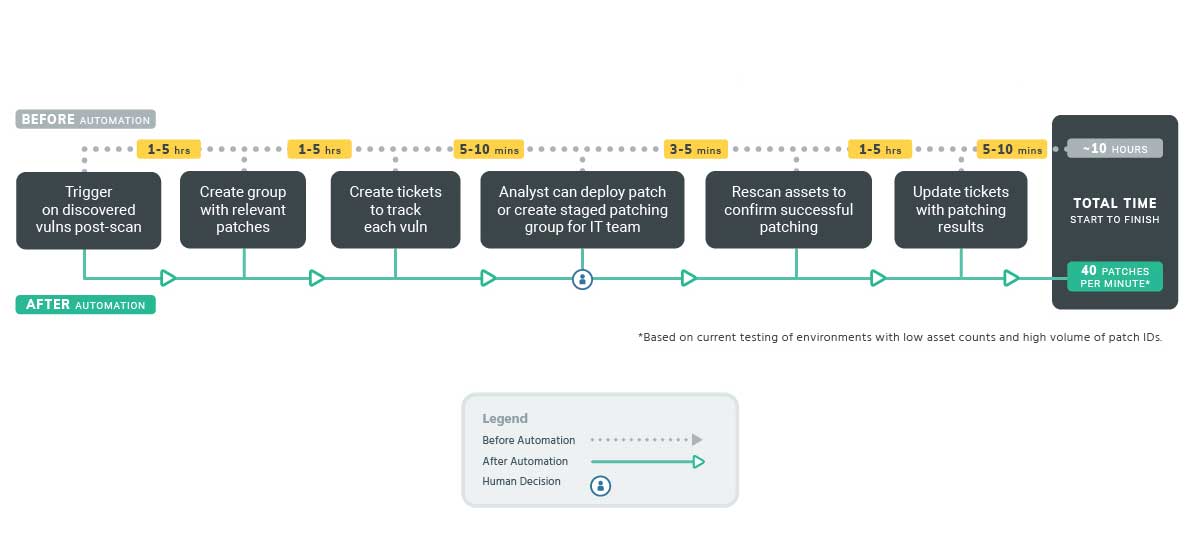
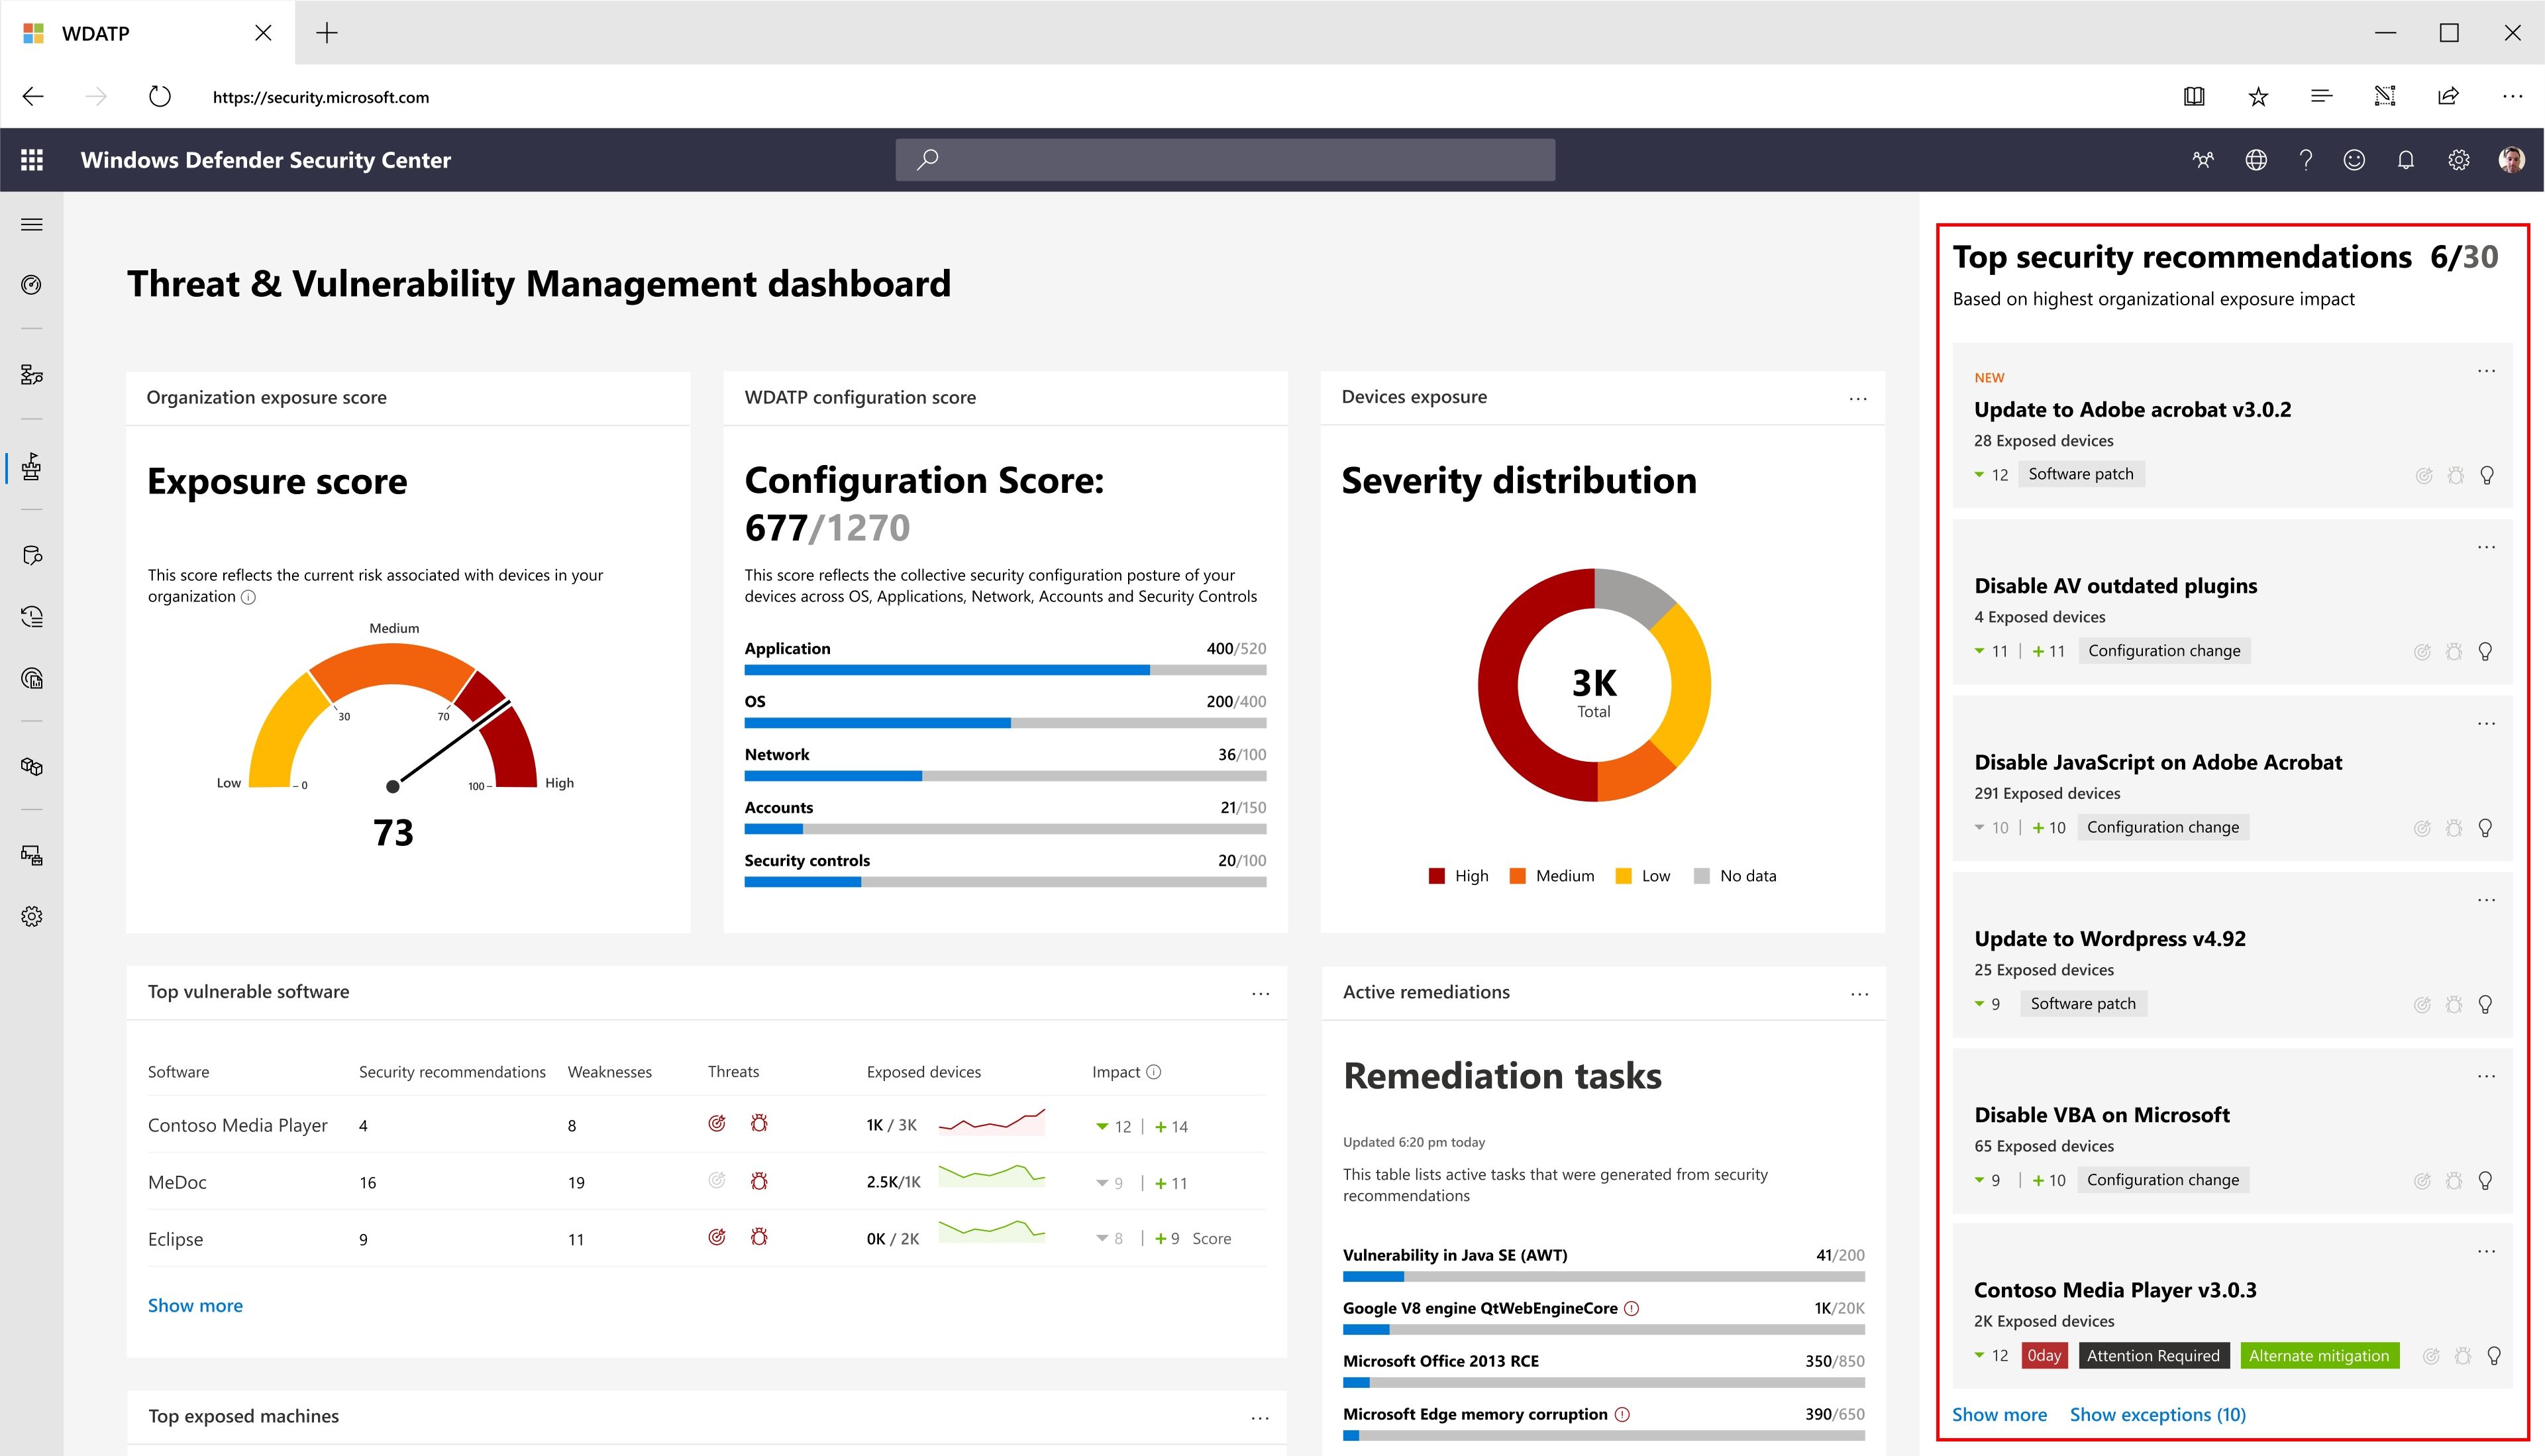
Patching and Remediation
The BigFix solution comprises several application products that provide consolidated security and operations management, simplified and streamlined endpoint management, while increasing accuracy and productivity.
Built-in remediation processes through Microsoft Intune and Microsoft System Center Configuration Manager

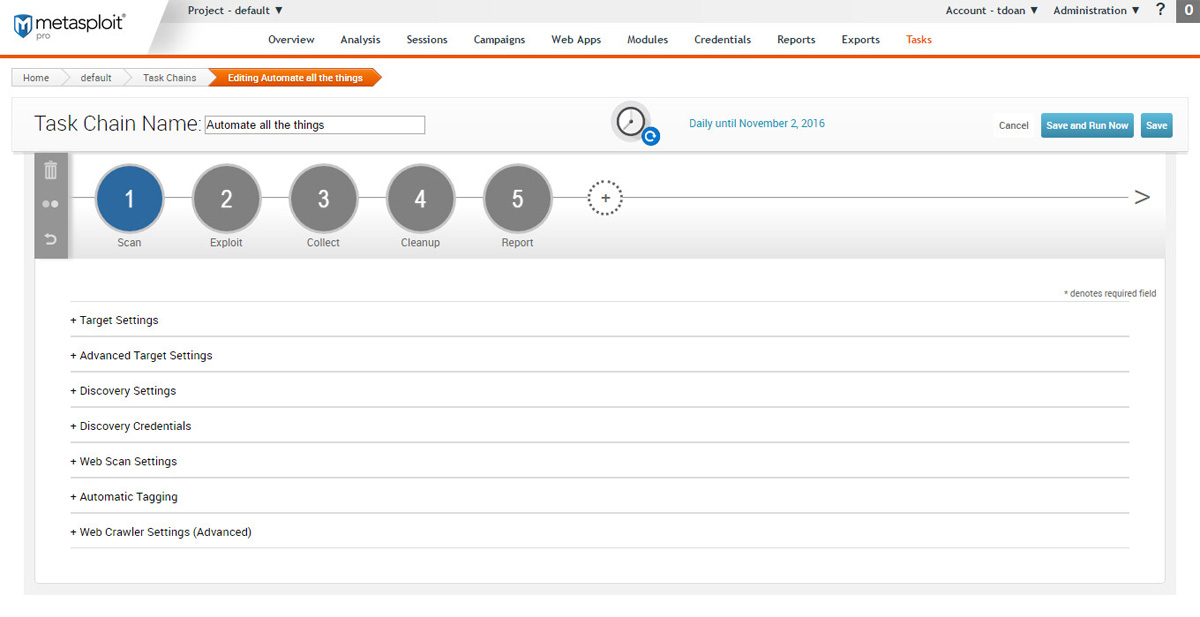
Verify remediation – Do you think your host has been patched against a specific vulnerability? Fire an exploit and find out!
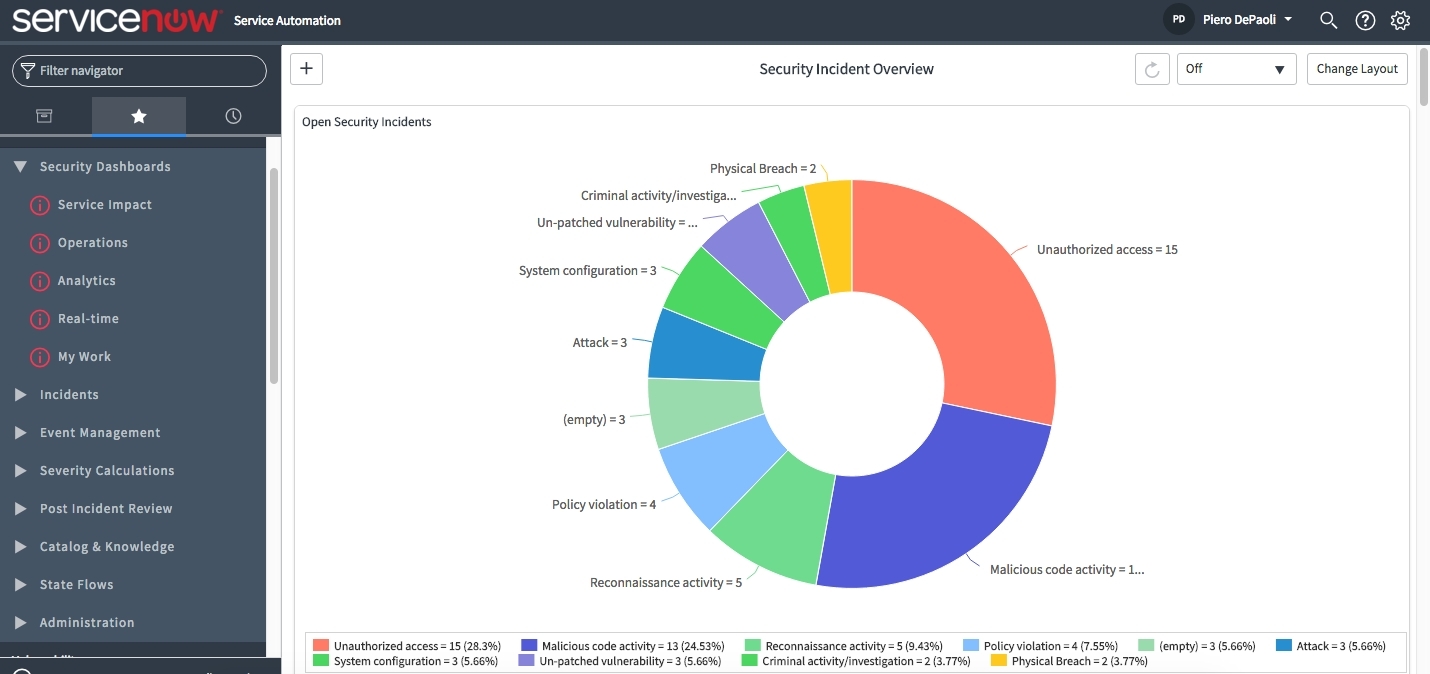
Automate mundane, manual functions to free up IT and security teams to address critical issues. By leveraging ServiceWatch, IT operations management software from ServiceNow, teams can trigger automatic patching, configuration changes to security infrastructure, or other standard workflows to contain and fix security incidents and vulnerabilities. Automatic post-incident reports are created, crucial for auditing purposes

  • the Splunk Phantom platform creates a complete picture of an incident, moving through Orient and Decide with crafted playbo
https://web.tufin.com/hubfs/partners/Splunk-TAP-partner-brief.pdf

  • What is ChatOps? Conversations, put to work

ChatOps is a collaboration model that connects people, tools, process, and automation into a transparent workflow. This flow connects the work needed, the work happening, and the work done in a persistent location staffed by the people, bots, and related tools. The transparency tightens the feedback loop, improves information sharing, and enhances team collaboration. Not to mention team culture and cross-training.
They also replaced repetitive tasks with automation, and replaced annual change control meetings with DevOps’ continuous collaboration.
And they pulled it all together into a central tool like Hipchat. That’s ChatOps in a nutshell.

These rooms are replacing email threads and meetings and are starting to evolve into new chat-based workflows.
As the members of a chat room perform their work, pull, share, or display information, others start to learn how to accomplish the same task. They develop a shared vision and establish a perspective on how their work impacts or informs others.

Technical teams have begun automating common tasks with advanced bots, while non-technical teams have started to deploy chat-based apps. Workloads are increasingly being done inside of chat and information is being brought into chat for collaboration via integration.

https://www.atlassian.com/blog/software-teams/what-is-chatops-adoption-guide?_ga=2.254598990.775318353.1497538188-1315074878.1497538188
ChatOps in Project Management
How ChatOps Can Help You DevOps Better
  • ServiceNow versus Splunk/Phantom for automation
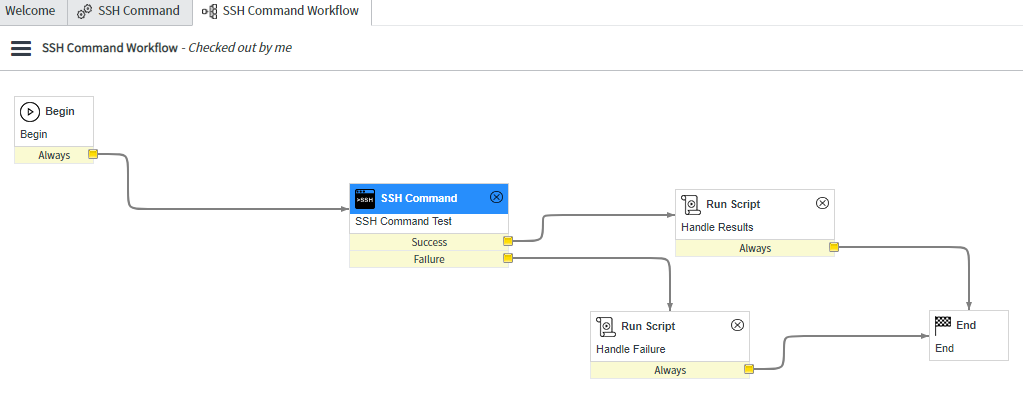
Phantom is on prem , python based platform and ServiceNow is SaaS, providing rich JS APIs.
Phantom architecture is based on containers made of one or more artifacts which are composite objects that can be automated on. SN is all about tables and client and server JS scripts which can be run in many places, on form load or submit, field change , before stored in database, after stored in database and few more. 
https://medium.com/@IrekRomaniuk/servicenow-versus-splunk-phantom-for-automation-ad7bfe4e8cfa
SSH command workflow in ServiceNow
Playbook running ssh command on remote host in Phantom
  • What is SIEM? What is SOAR? How are they different?

What is SIEM?

Firewalls, network appliances and intrusion detection systems generate an immense amount of event-related data—more data than security teams can reasonably expect to interpret. A SIEM makes sense of all of this data by collecting and aggregating and then identifying, categorizing and analyzing incidents and events. This is often done using machine learning, specialized analytics software and dedicated sensors.
A SIEM solution examines log data for patterns that could indicate a cyberattack, then correlates event information between devices to identify potentially anomalous activity and finally, issues alerts accordingly.

So why isn’t a SIEM solution effective on its own?
It usually needs regular tuning to continually understand and differentiate between anomalous and normal activity. The need for regular tuning leads to security analysts and engineers wasting precious time on making the tool work for them instead of triaging the constant influx of data.

What is SOAR?
Like SIEM, SOAR is designed to help security teams manage and respond to endless alarms at machine speeds
OAR takes things a step further by combining comprehensive data gathering, case management, standardization, workflow and analytics to provide organizations the ability to implement sophisticated defense-in-depth capabilities.

SOAR solutions include multiple playbooks in response to specific threats: Each step in a playbook can be fully automated or set up for one-click execution directly from within the platform—like Swimlane—including interaction with third-party products for comprehensive integration.

Using SIEM and SOAR for improved SecOps

https://swimlane.com/blog/siem-soar/

What is SOAR? SOAR connects all of the other tools in your security stack together into defined
workflows, which can be run automatically. In other words, SOAR lets you increase your team's
efficiency by Automating repetitive manual processes

https://training.fortinet.com/pluginfile.php/1625390/mod_scorm/content/1/story_content/external_files/NSE%202%20SOAR%20Script_EN.pdf