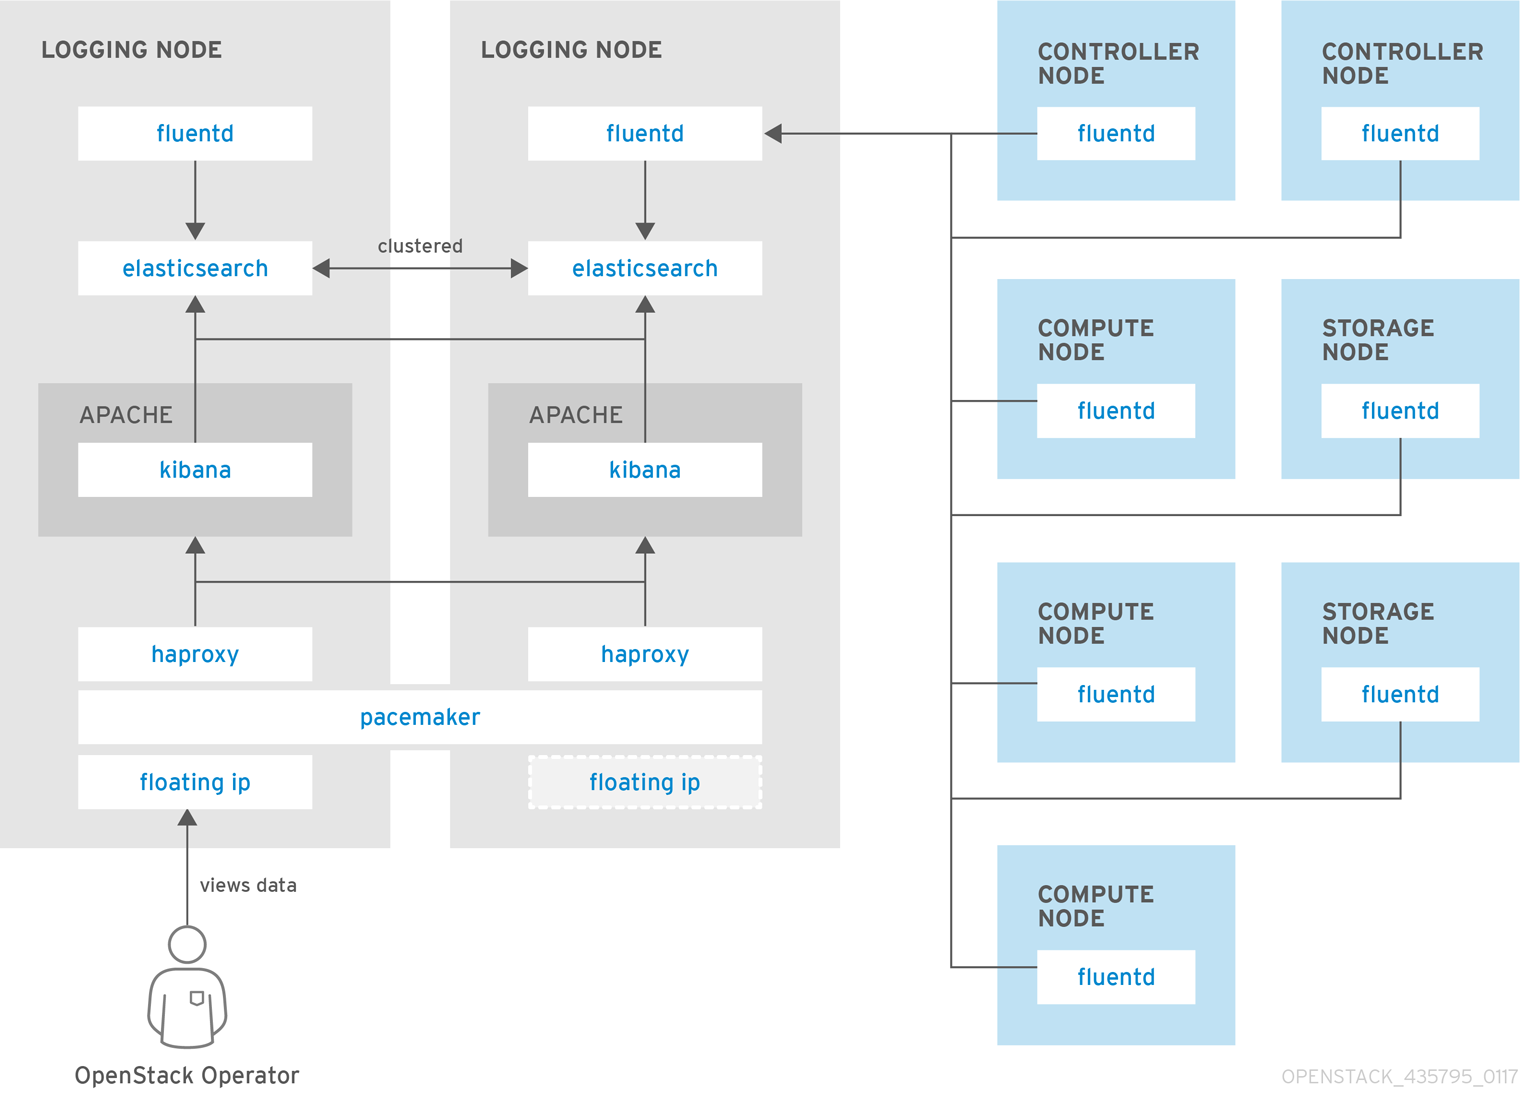
Centralized logging: Allows you gather logs from all components in the OpenStack environment in one central location. You can identify problems across all nodes and services, and optionally, export the log data to Red Hat for assistance in diagnosing problems.
Availability monitoring: Allows you to monitor all components in the OpenStack environment and determine if any components are currently experiencing outages or are otherwise not functional. You can also configure the system to alert you when problems are identified.
Monitoring tools use a client-server model with the client deployed onto the Red Hat OpenStack Platform overcloud nodes.
The Fluentd service provides client-side centralized logging (CL) and
the Sensu client service provides client-side availability monitoring (AM).
2.1. Centralized Logging
Centralized logging allows you to have one central place to view logs across your entire OpenStack environment. These logs come from the operating system, such as syslog and audit log files, infrastructure components such as RabbitMQ and MariaDB, and OpenStack services such as Identity, Compute, and others.
The centralized logging toolchain consists of a number of components, including:
Log Collection Agent (Fluentd)
Log Relay/Transformer (Fluentd)
Data Store (Elasticsearch)
API/Presentation Layer (Kibana)
2.2. Availability Monitoring
Availability monitoring allows you to have one central place to monitor the high-level functionality of all components across your entire OpenStack environment.
The availability monitoring toolchain consists of a number of components, including:
Monitoring Agent (Sensu client)
Monitoring Relay/Proxy (RabbitMQ)
Monitoring Controller/Server (Sensu server)
API/Presentation Layer (Uchiwa)
https://access.redhat.com/documentation/en-us/red_hat_openstack_platform/15/html-single/monitoring_tools_configuration_guide/index
Nagios
ensure that the nova-compute process is running on the compute nodes, create an alert on your Nagios server
Nagios alerts you with a WARNING when any disk on the compute node is 80 percent full and CRITICAL when 90 percent is full.
StackTach
StackTach is a tool that collects and reports the notifications sent by nova
Logstash
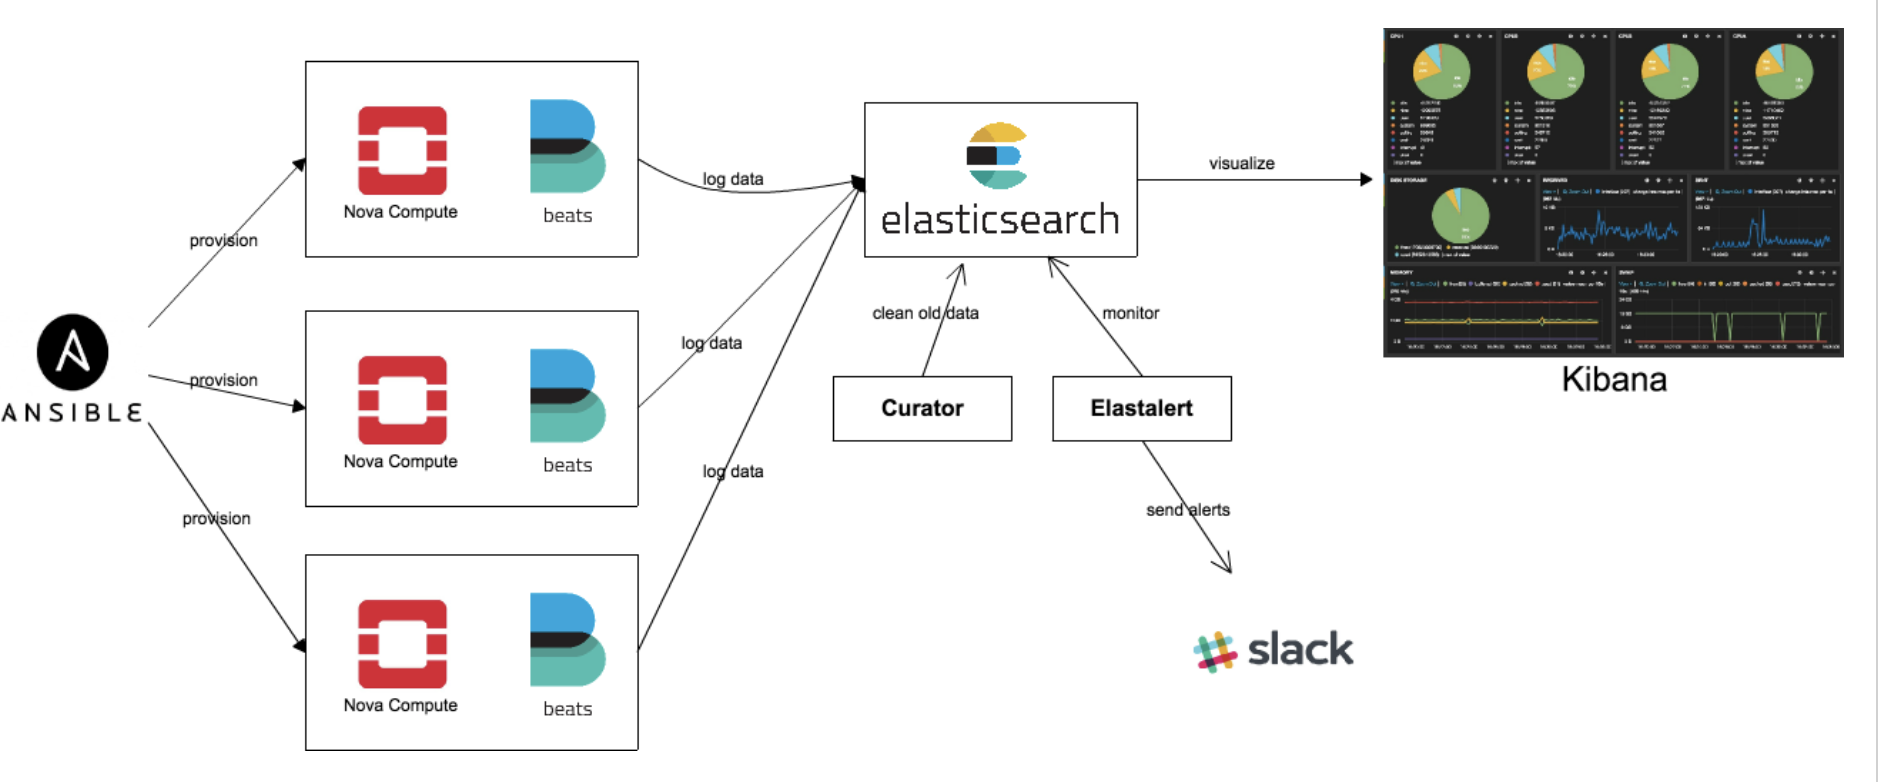
Logstash is a high performance indexing and search engine for logs. Logs from Jenkins test runs are sent to logstash where they are indexed and stored. Logstash facilitates reviewing logs from multiple sources in a single test run, searching for errors or particular events within a test run, and searching for log event trends across test runs.
There are four major layers in Logstash setup which are:
Log Pusher
Log Indexer
ElasticSearch
Kibana
https://wiki.openstack.org/wiki/OpsGuide-Monitoring#Monitoring_Tools
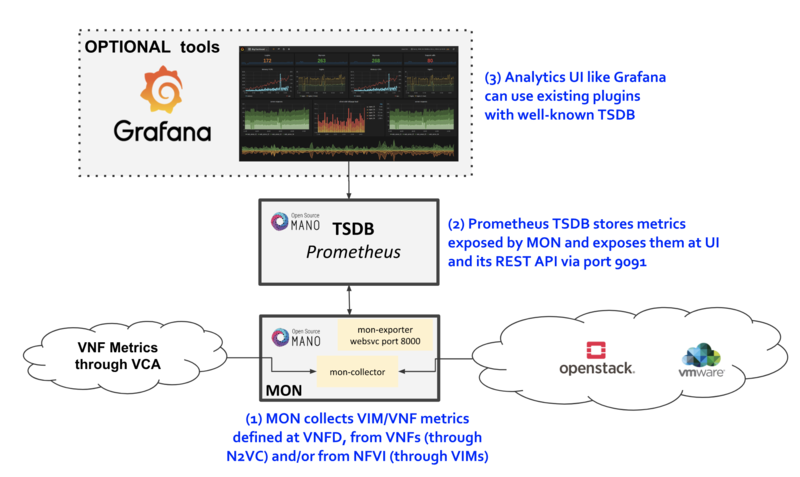
- Using Prometheus Operator to monitor OpenStack
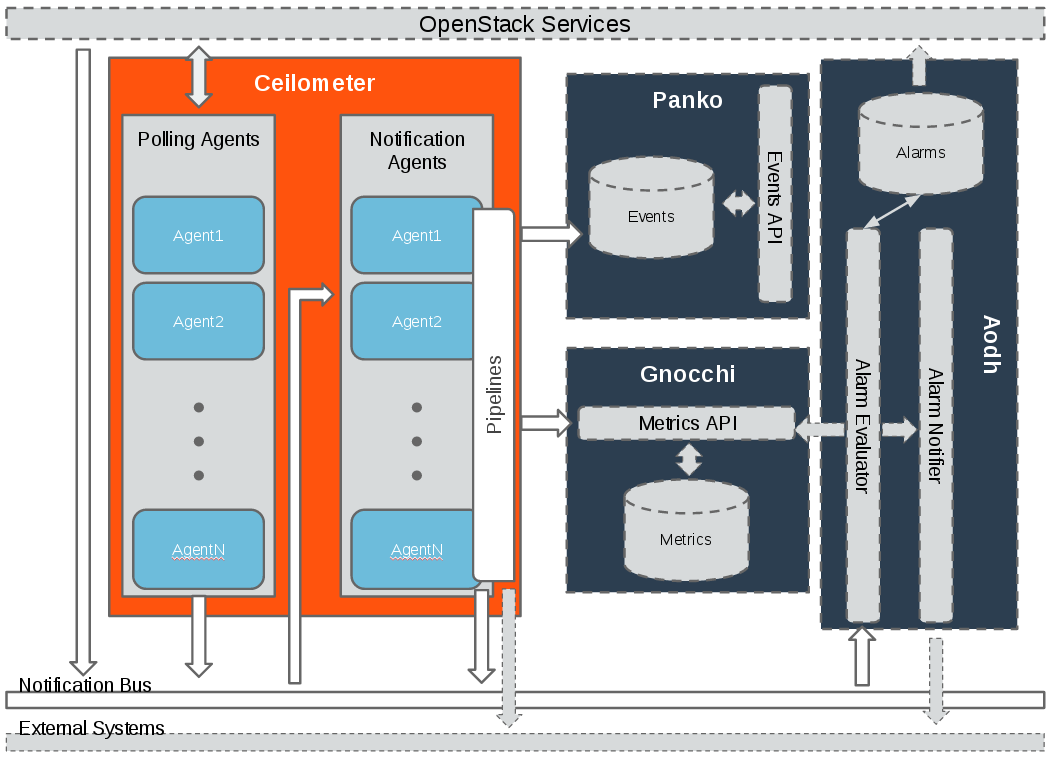
Monitoring at scale issues - Ceilometer
Current OpenStack telemetry & metrics/events mechanisms most
suited for chargeback applications
A typical monitoring interval for Ceilometer/Panko/Aodh/Gnocchi
combination is 10 minutes
Monitoring at scale issues - collectd
Red Hat OpenStack Platform included collectd for performance monitoring using
collectd plug-ins
Similar issues as Ceilometer with monitoring at scale
Problem:
Current Openstack telemetry and metrics do not scale for large
enterprises & to monitor the health of NFVi for telcos
Time series database / management cluster level
Prometheus Operator
CEILOMETER & GNOCCHI will continue to be used for chargeback and
tenant metering
Prometheus
Open Source Monitoring
● Only Metrics, Not Logging
● Pull based approach
● Multidimensional data model
● Time series database
● Evaluates rules for alerting and triggers alerts
● Flexible, Robust query language - PromQL
What is Operator?
Automated Software Management
purpose-built to run a Kubernetes application,
with operational knowledge baked in
Manage Installation & lifecycle of Kubernetes applications
Extends native kubernetes configuration hooks
Custom Resource definitions
Prometheus Operator
Prometheus operational knowledge in software
● Easy deployment & maintenance of prometheus
● Abstracts out complex configuration paradigms
● Kubernetes native configuration
● Preserves the configurability
Other Components
ElasticSearch
○ System events and logs are stored in ElasticSearch as part of an ELK stack running
in the same cluster as the Prometheus Operator
○ Events are stored in ElasticSearch and can be forwarded to Prometheus Alert
Manager
○ Alerts that are generated from Prometheus Alert rule processing can be sent from
Prometheus Alert Manager to the QDR bus
Smart Gateway -- AMQP / Prometheus bridge
○ Receives metrics from AMQP bus, converts collectd format to Prometheus, coallates
data from plugins and nodes, and presents the data to Prometheus through an HTTP
server
○ Relay alarms from Prometheus to AMQP bus
Grafana
○ Prometheus data source to visualize data
Prometheus Management Cluster
Runs Prometheus Operator on top of Kubernetes
● A collection of Kubernetes manifests and Prometheus rules
combined to provide single-command deployments
● Introduces resources such as Prometheus, Alert Manager,
ServiceMonitor
● Elasticsearch for storing Events
● Grafana dashboards for visualization
● Self-monitoring cluster
https://object-storage-ca-ymq-1.vexxhost.net/swift/v1/6e4619c416ff4bd19e1c087f27a43eea/www-assets-prod/presentation-media/OpenStack-Summit-2018-Prometheus-Operator-to-monitor-OpenStack.pdf
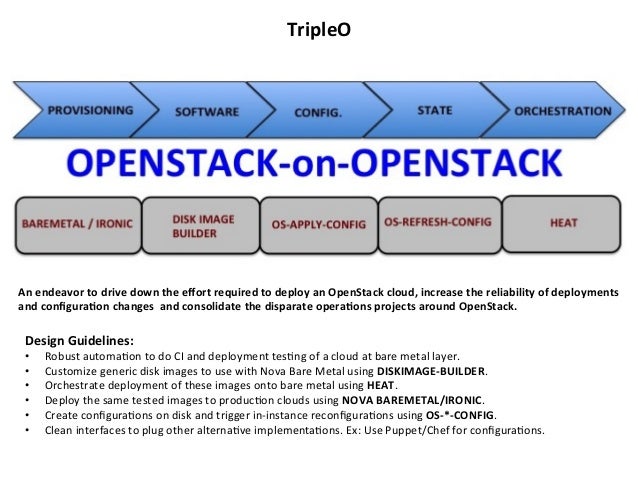
- TripleO is a project aimed at installing, upgrading and operating OpenStack clouds using OpenStack’s own cloud facilities as the foundation - building on Nova, Ironic, Neutron and Heat to automate cloud management at datacenter scale
https://docs.openstack.org/tripleo-docs/latest/
- TripleO (OpenStack On OpenStack) is a program aimed at installing, upgrading and operating OpenStack clouds using OpenStack's own cloud facilities as the foundations - building on nova, neutron and heat to automate fleet management at datacentre scale.
https://wiki.openstack.org/wiki/TripleO
- TripleO is an OpenStack Deployment & Management tool.
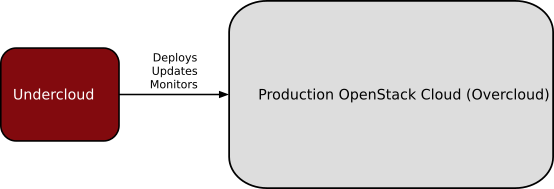
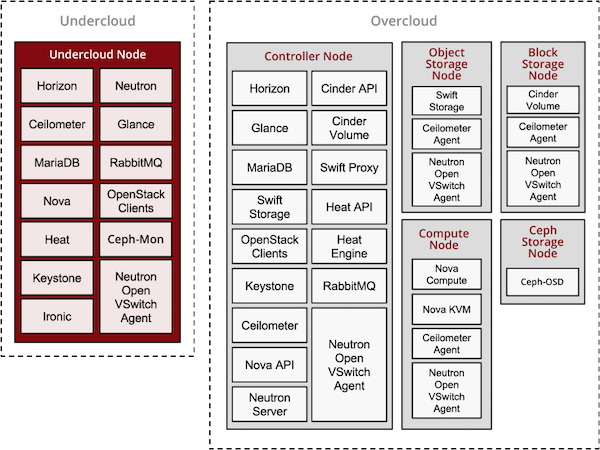
With TripleO, you start by creating an undercloud (an actual operator facing deployment cloud) that will contain the necessary OpenStack components to deploy and manage an overcloud (an actual tenant facing workload cloud). The overcloud is the deployed solution and can represent a cloud for any purpose (e.g. production, staging, test, etc). The operator can choose any of available Overcloud Roles (controller, compute, etc.) they want to deploy to the environment.
https://docs.openstack.org/tripleo-docs/latest/install/introduction/introduction.html
TripleO is the friendly name for “OpenStack on OpenStack”. It is an official OpenStack project with the goal of allowing you to deploy and manage a production cloud onto bare metal hardware using a subset of existing OpenStack components.
With TripleO, you start by creating an “undercloud” (a deployment cloud) that will contain the necessary OpenStack components to deploy and manage an “overcloud” (a workload cloud). The overcloud is the deployed solution and can represent a cloud for any purpose (e.g. production, staging, test, etc).
TripleO leverages several existing core components of OpenStack including Nova, Ironic, Neutron, Heat, Glance and Ceilometer to deploy OpenStack on baremetal hardware
Nova and Ironic are used in the undercloud to manage baremetal instances that comprise the infrastructure for the overcloud.
Neutron is utilized to provide a networking environment in which to deploy the overcloud, machine images are stored in Glance, and Ceilometer collects metrics about your overcloud.
https://docs.openstack.org/tripleo-docs/latest/install/introduction/architecture.html

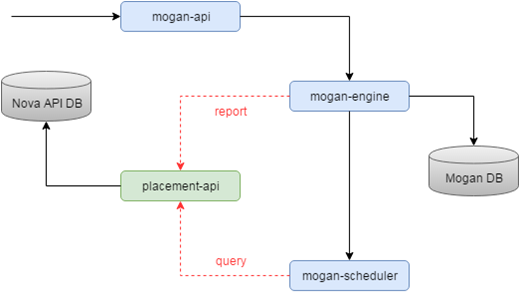
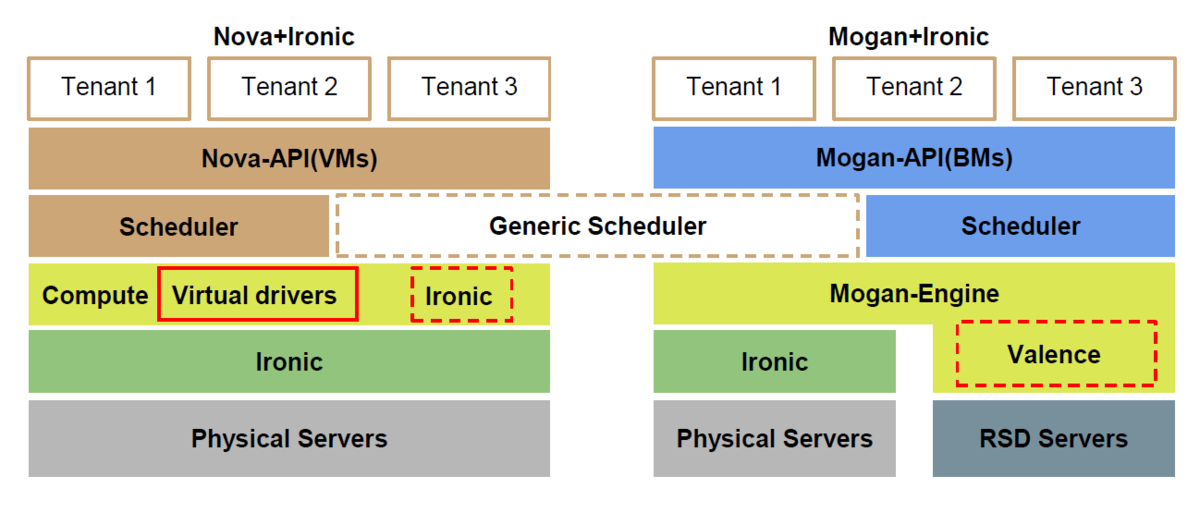
Mogan is an OpenStack project which offers bare metals as first class resources to users, supporting variety of bare metal provisioning drivers including Ironic.
Why Mogan?
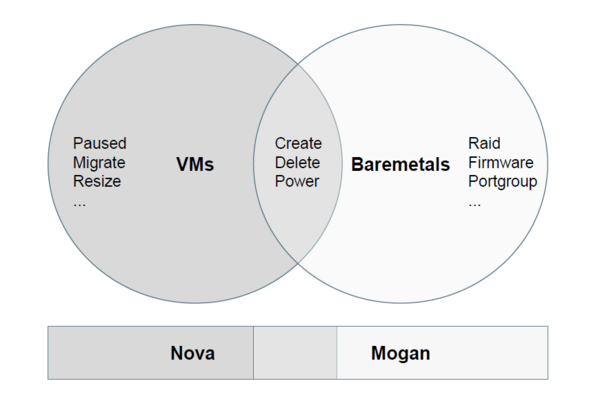
OpenStack Nova supports provisioning of virtual machines (VMs), bare metal and containers. True, BUT, Nova design started off as a virtual machine scheduler, with features specific to this use case. Nova enhancements to unify requesting any compute instance, be it VM, container or Bare Metal, while wonderful, unfortunately is convoluted at best, requiring the user to execute additional steps. Further, it does not yet support the more advanced requirements of bare metal provisioning such as storage and network configuration.
All Ironic nodes are associated with a single host aggregate in Nova, because of the notion that a compute *service* is equal to the compute *node*.
No affinity/anti-affinity support for bare metals in Nova, as it's based on *host*.
No specific APIs for bare metals like RAID configuration, Advanced partitioning at deploy time, Firmware management, etc.
https://wiki.openstack.org/wiki/Mogan
- Keystone is an OpenStack service that provides API client authentication, service discovery, and distributed multi-tenant authorization by implementing OpenStack’s Identity API.
https://docs.openstack.org/keystone/latest/
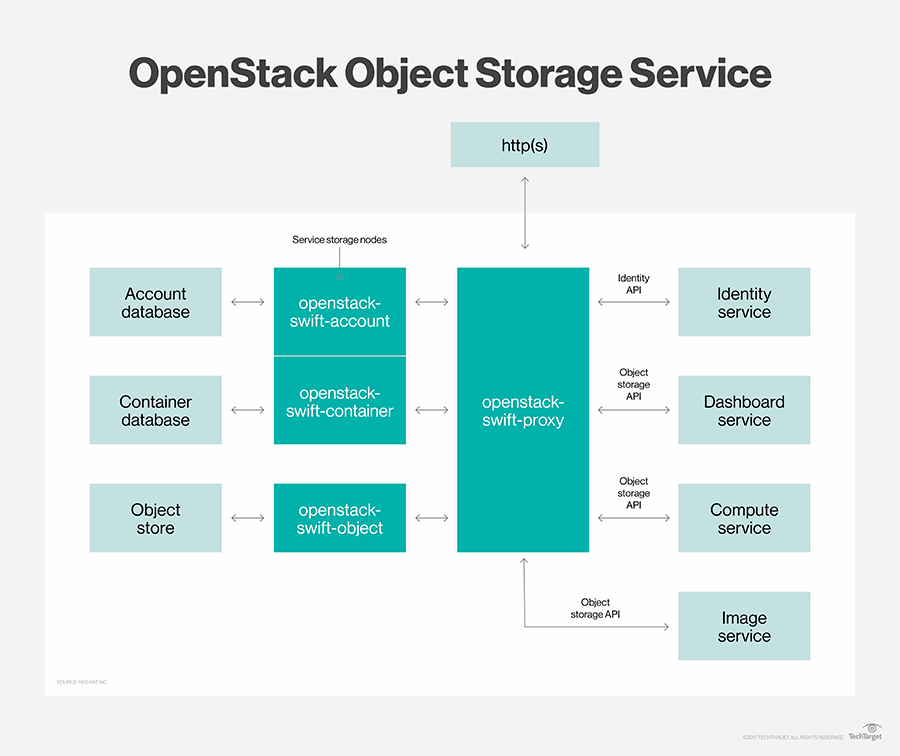
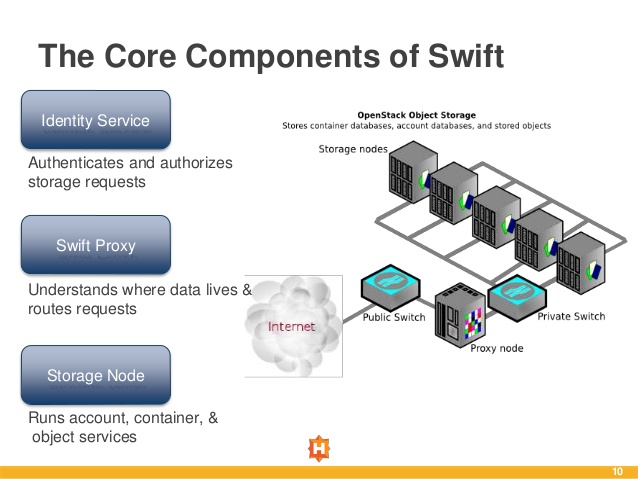
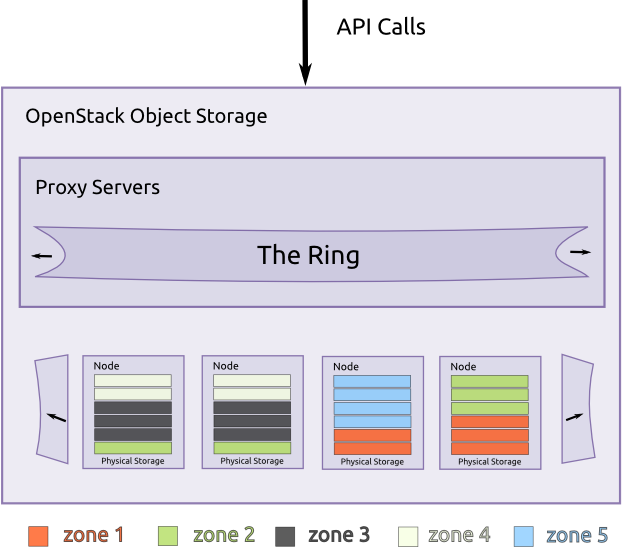
- The OpenStack Object Store project, known as Swift, offers cloud storage software so that you can store and retrieve lots of data with a simple API. It's built for scale and optimized for durability, availability, and concurrency across the entire data set. Swift is ideal for storing unstructured data that can grow without bound
https://wiki.openstack.org/wiki/Swift
What is Cinder?
Cinder is the OpenStack Block Storage service for providing volumes to Nova virtual machines, Ironic bare metal hosts, containers and more. Some of the goals of Cinder are to be/have:
Component based architecture: Quickly add new behaviors
Highly available: Scale to very serious workloads
Fault-Tolerant: Isolated processes avoid cascading failures
Recoverable: Failures should be easy to diagnose, debug, and rectify
Open Standards: Be a reference implementation for a community-driven ap
https://docs.openstack.org/cinder/latest/
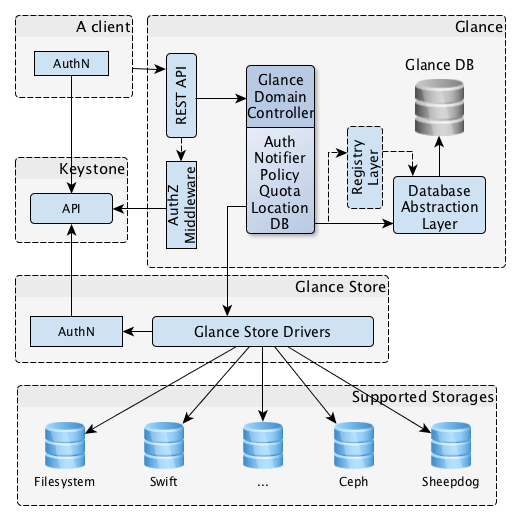
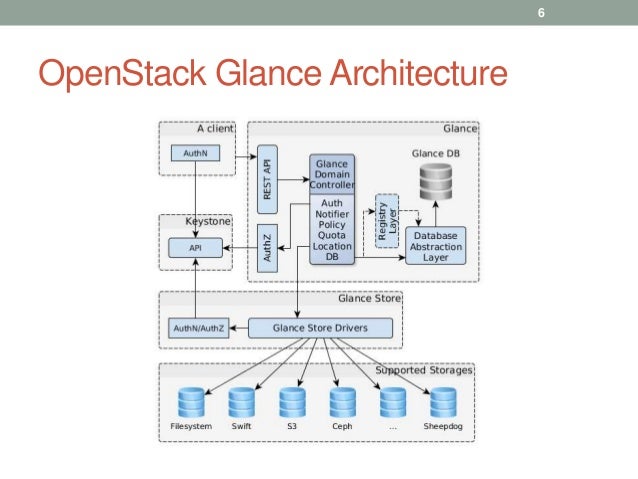
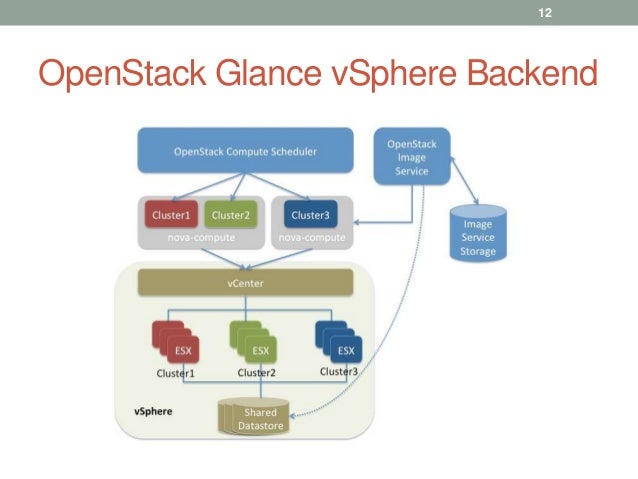
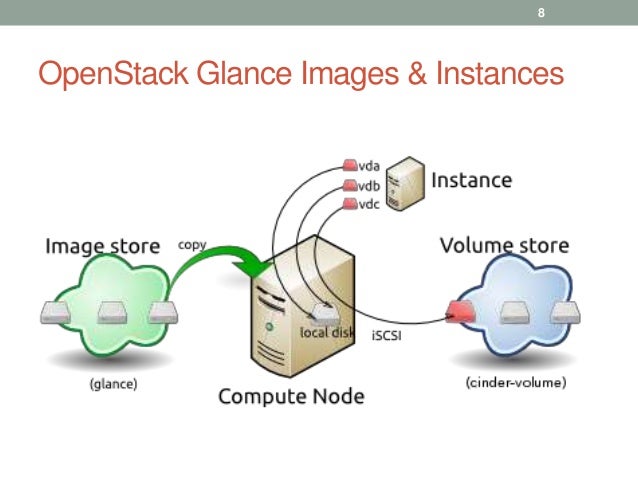
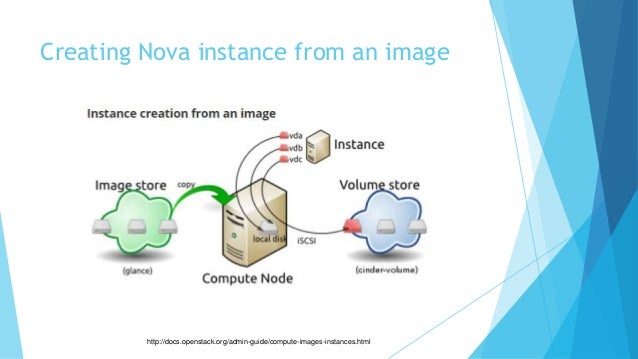
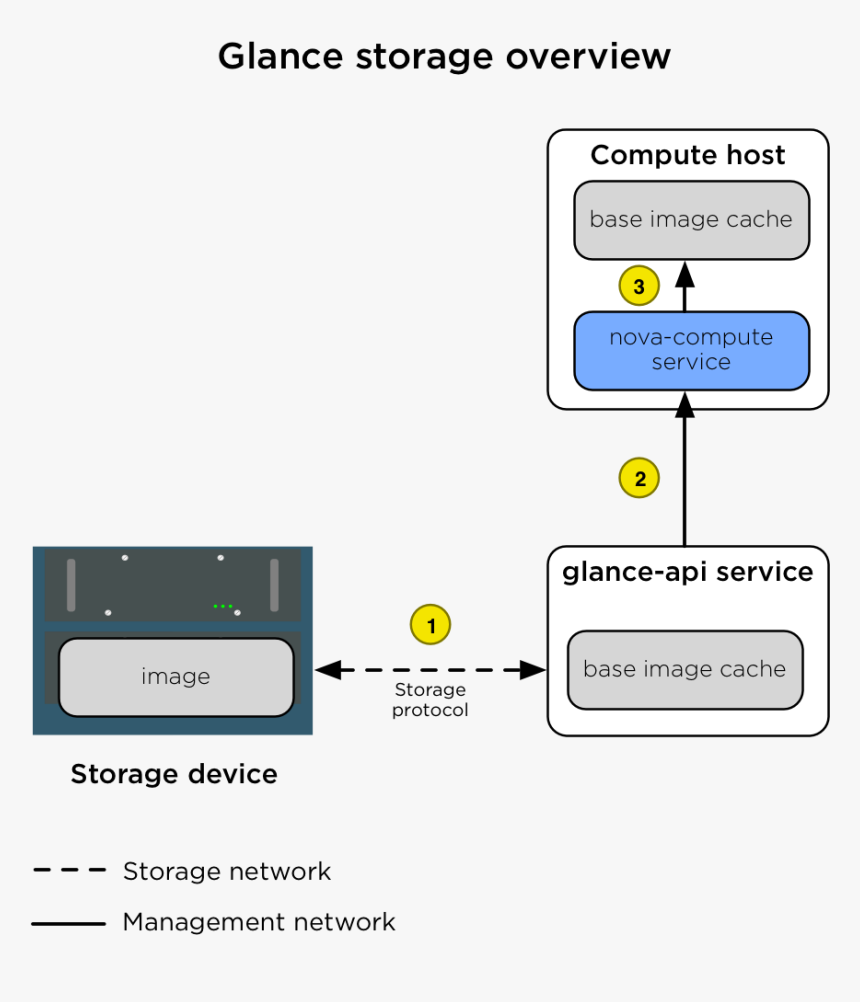
Glance image services include discovering, registering, and retrieving virtual machine (VM) images. Glance has a RESTful API that allows querying of VM image metadata as well as retrieval of the actual image.
https://docs.openstack.org/glance/latest/
What is nova?
Nova is the OpenStack project that provides a way to provision compute instances (aka virtual servers). Nova supports creating virtual machines, baremetal servers (through the use of ironic), and has limited support for system containers. Nova runs as a set of daemons on top of existing Linux servers to provide that service.
It requires the following additional OpenStack services for basic function:
Keystone: This provides identity and authentication for all OpenStack services.
Glance: This provides the compute image repository. All compute instances launch from glance images.
Neutron: This is responsible for provisioning the virtual or physical networks that compute instances connect to on boot.
Placement: This is responsible for tracking inventory of resources available in a cloud and assisting in choosing which provider of those resources will be used when creating a virtual machine.
https://docs.openstack.org/nova/latest/
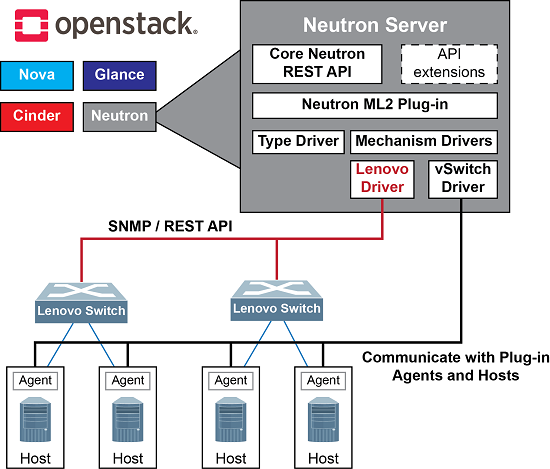
Neutron is an OpenStack project to provide “network connectivity as a service” between interface devices (e.g., vNICs) managed by other OpenStack services (e.g., nova). It implements the OpenStack Networking API.
https://docs.openstack.org/neutron/latest/

The Modular Layer 2 (ml2) plugin is a framework allowing OpenStack Networking to simultaneously utilize the variety of layer 2 networking technologies found in complex real-world data centers. It currently works with the existing openvswitch, linuxbridge, and hyperv L2 agents, and is intended to replace and deprecate the monolithic plugins associated with those L2 agents
https://wiki.openstack.org/wiki/Neutron/ML2
- 2.5.1. The reasoning behind ML2
Previously, OpenStack Networking deployments were only able to use the plug-in that had been selected at implementation time. For example, a deployment running the Open vSwitch plug-in was only able to use Open vSwitch exclusively; it wasn’t possible to simultaneously run another plug-in such as linuxbridge. This was found to be a limitation in environments with heterogeneous requirements.
2.5.2. ML2 network types
Multiple network segment types can be operated concurrently. In addition, these network segments can interconnect using ML2’s support for multi-segmented networks. Ports are automatically bound to the segment with connectivity; it is not necessary to bind them to a specific segment. Depending on the mechanism driver, ML2 supports the following network segment types:
flat
GRE
local
VLAN
VXLAN
https://access.redhat.com/documentation/en-us/red_hat_openstack_platform/12/html/networking_guide/openstack_networking_concepts

- The placement API service was introduced in the 14.0.0 Newton release within the nova repository and extracted to the placement repository in the 19.0.0 Stein release. This is a REST API stack and data model used to track resource provider inventories and usages, along with different classes of resources. For example, a resource provider can be a compute node, a shared storage pool, or an IP allocation pool. The placement service tracks the inventory and usage of each provider. For example, an instance created on a compute node may be a consumer of resources such as RAM and CPU from a compute node resource provider, disk from an external shared storage pool resource provider and IP addresses from an external IP pool resource provider.
The types of resources consumed are tracked as classes. The service provides a set of standard resource classes (for example DISK_GB, MEMORY_MB, and VCPU) and provides the ability to define custom resource classes as needed.
Each resource provider may also have a set of traits which describe qualitative aspects of the resource provider. Traits describe an aspect of a resource provider that cannot itself be consumed but a workload may wish to specify. For example, available disk may be solid state drives (SSD).
https://docs.openstack.org/placement/latest/
- Heat is a service to orchestrate composite cloud applications using a declarative template format through an OpenStack-native REST API.
Heat’s purpose and vision
Heat provides a template based orchestration for describing a cloud application by executing appropriate OpenStack API calls to generate running cloud applications.
A Heat template describes the infrastructure for a cloud application in text files which are readable and writable by humans, and can be managed by version control tools.
Templates specify the relationships between resources (e.g. this volume is connected to this server). This enables Heat to call out to the OpenStack APIs to create all of your infrastructure in the correct order to completely launch your application.
The software integrates other components of OpenStack. The templates allow creation of most OpenStack resource types (such as instances, floating ips, volumes, security groups, users, etc), as well as some more advanced functionality such as instance high availability, instance autoscaling, and nested stacks.
Heat primarily manages infrastructure, but the templates integrate well with software configuration management tools such as Puppet and Ansible.
Operators can customise the capabilities of Heat by installing plugins.
https://docs.openstack.org/heat/latest/
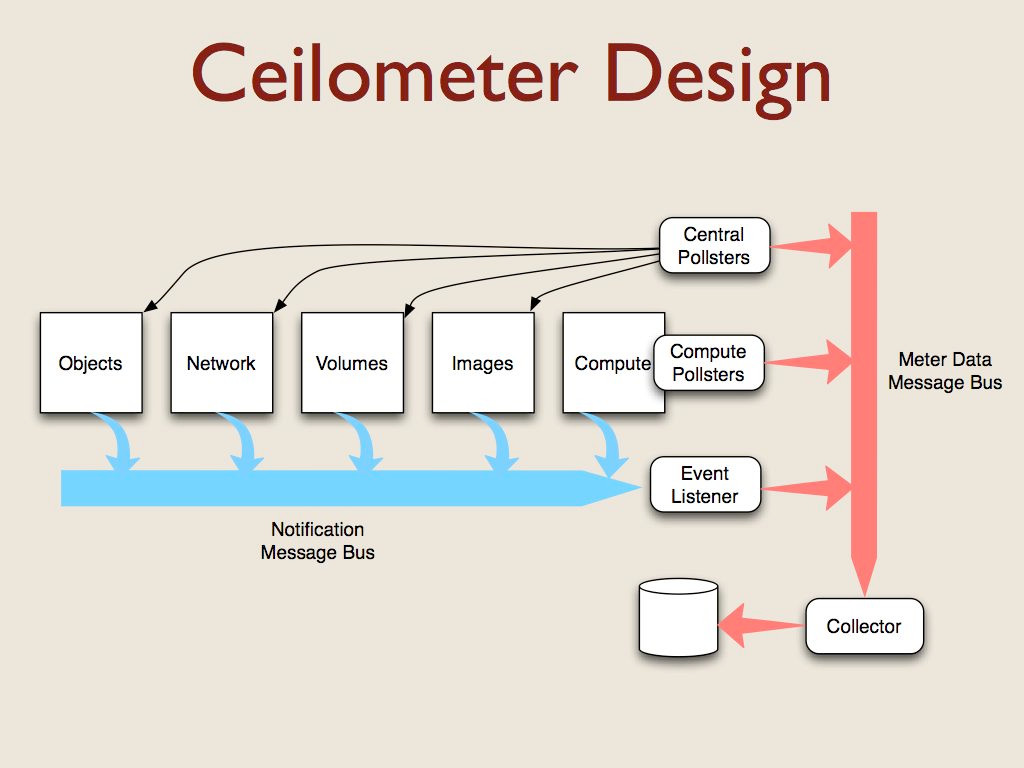
- The Ceilometer project is a data collection service that provides the ability to normalise and transform data across all current OpenStack core components with work underway to support future OpenStack components.
Ceilometer is a component of the Telemetry project. Its data can be used to provide customer billing, resource tracking, and alarming capabilities across all OpenStack core components.
https://docs.openstack.org/ceilometer/latest/
- OpenStack cloud is to set up security options that go beyond password-based user authentication when you create a new instance
the OpenStack Dashboard, Horizon, to set up a public/private OpenStack keypair to properly protect the instance at launch time.
A Public/private OpenStack keypair works by keeping the public key on the server, and the private key on your local workstation
A public OpenStack ssh key can be injected into an instance on launch, so that it’s ready for you to access using the private key
If you then set up ssh to deny password authentication and instead require the key, you give your instance a much stronger layer of security.
The downside of PuTTY is that it doesn’t like the *.pem format OpenStack gives you, in which the public and private key are together; instead you must separate them using the PuTTYgen client:
https://www.mirantis.com/blog/openstack-security-tip-create-a-keypair-for-accessing-vms/
- The project code-name for Networking services is neutron. OpenStack Networking handles the creation and management of a virtual networking infrastructure, including networks, switches, subnets, and routers for devices managed by the OpenStack Compute service (nova). Advanced services such as firewalls or virtual private network (VPN) can also be used.
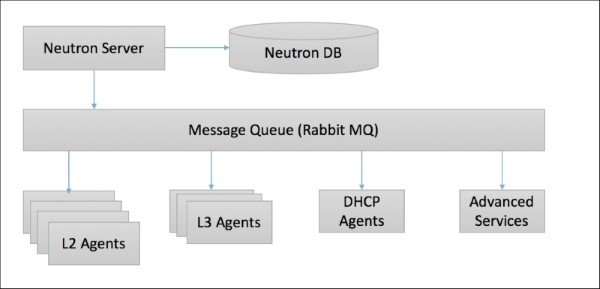
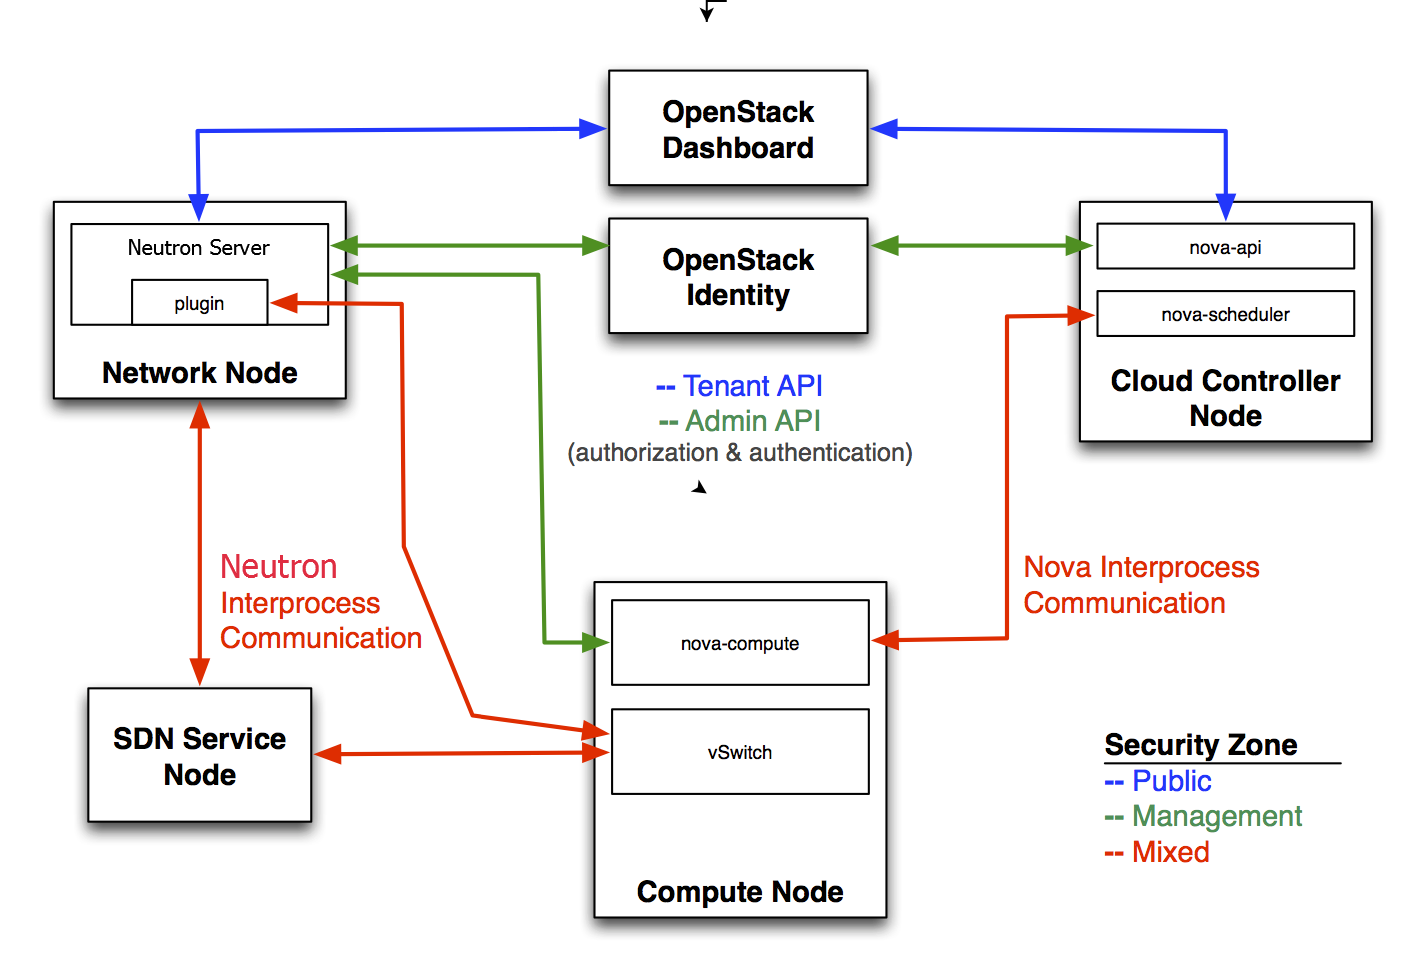
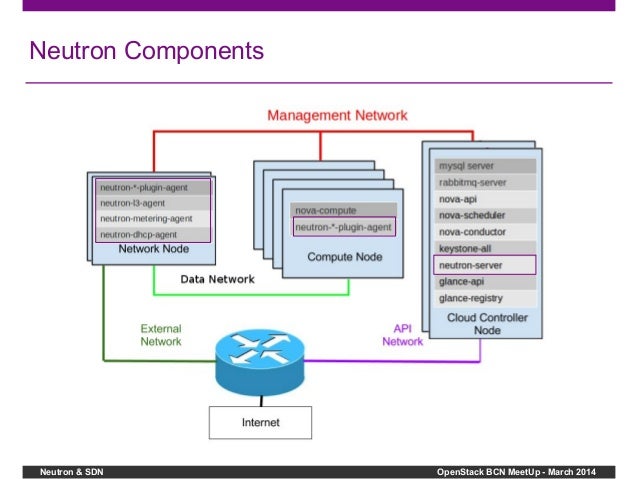
OpenStack Networking consists of the neutron-server, a database for persistent storage, and any number of plug-in agents, which provide other services such as interfacing with native Linux networking mechanisms, external devices, or SDN controller
OpenStack Networking is entirely standalone and can be deployed to a dedicated host. If your deployment uses a controller host to run centralized Compute components, you can deploy the Networking server to that specific host instead
OpenStack Networking integrates with various OpenStack components:
OpenStack Identity service (keystone) is used for authentication and authorization of API requests.
OpenStack Compute service (nova) is used to plug each virtual NIC on the VM into a particular network.
OpenStack Dashboard (horizon) is used by administrators and project users to create and manage network services through a web-based graphical interface.
https://docs.openstack.org/neutron/latest/admin/intro.html
Provider networks offer layer-2 connectivity to instances with optional support for DHCP and metadata services. These networks connect, or map, to existing layer-2 networks in the data center, typically using VLAN (802.1q) tagging to identify and separate them.
Subnets
A block of IP addresses and associated configuration state. This is also known as the native IPAM (IP Address Management) provided by the networking service for both project and provider networks. Subnets are used to allocate IP addresses when new ports are created on a network.
Subnet pools
End users normally can create subnets with any valid IP addresses without other restrictions. However, in some cases, it is nice for the admin or the project to pre-define a pool of addresses from which to create subnets with automatic allocation.
Using subnet pools constrains what addresses can be used by requiring that every subnet be within the defined pool. It also prevents address reuse or overlap by two subnets from the same pool.
Ports
A port is a connection point for attaching a single device, such as the NIC of a virtual server, to a virtual network. The port also describes the associated network configuration, such as the MAC and IP addresses to be used on that port.
Routers
Routers provide virtual layer-3 services such as routing and NAT between self-service and provider networks or among self-service networks belonging to a project. The Networking service uses a layer-3 agent to manage routers via namespaces.
Security groups
Security groups provide a container for virtual firewall rules that control ingress (inbound to instances) and egress (outbound from instances) network traffic at the port level.
Security groups use a default deny policy and only contain rules that allow specific traffic.
Each port can reference one or more security groups in an additive fashion. The firewall driver translates security group rules to a configuration for the underlying packet filtering technology such as iptable
Each project contains a default security group that allows all egress traffic and denies all ingress traffic.
You can change the rules in the default security group. If you launch an instance without specifying a security group, the default security group automatically applies to it. Similarly, if you create a port without specifying a security group, the default security group automatically applies to it.
Security group rules are stateful. Thus, allowing ingress TCP port 22 for secure shell automatically creates rules that allow return egress traffic and ICMP error messages involving those TCP connections.
By default, all security groups contain a series of basic (sanity) and anti-spoofing rules
Although non-IP traffic, security groups do not implicitly allow all ARP traffic. Separate ARP filtering rules prevent instances from using ARP to intercept traffic for another instance. You cannot disable or remove these rules.
You can disable security groups including basic and anti-spoofing rules by setting the port attribute port_security_enabled to False.
https://docs.openstack.org/neutron/latest/admin/intro-os-networking.html